 |
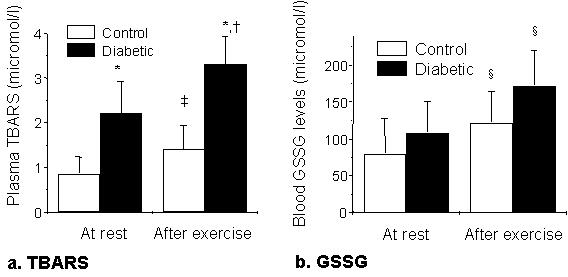
| Figure 3. Mean levels of (a) plasma thiobarbituric
acid reacting substances (TBARS) and (b) glutathione disulfide (GSSG)
before and after exercise for the diabetic and control groups. Error bars
represent SD. * Diabetic vs. control group, P<0.005, Mann-Whitney. † Diabetic group, before vs. after exercise, P=0.001. ‡ Control group, before vs. after exercise: P=0.012. § Before vs. after exercise, P<0.005. |