|
Appendix A: Schematic representation of the playing positions |
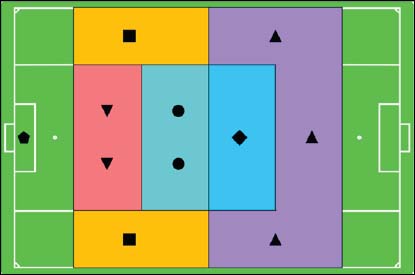
Schematic representation
of the playing positions. Forwards (upright triangles in purple area),
attacking midfielders (diamond in blue area), defending midfielders (circles
in green area), backs (squares in yellow area) and central defenders (inverted
triangles in red area). The goalkeeper is depicted as a pentagon.
|
|
|
Appendix B: MAS and MSS |
|
Introduction MAS was defined as the running speed at which V̇O2max was attained. Since V̇O2max was calculated using a 30-s rolling average, the midpoint of this window was used to determine the time at which V̇O2max occurred. To derive MAS as a continuous variable rather than a discrete one, the running speed was interpolated based on the elapsed time within the final stage, proportionally assigning a speed between the current and subsequent stage of the test. The MSS was defined as the highest speed recorded during the 20-meter sprint. This likely underestimates the players’ true maximum speed because a longer distance, closer to 40 meters, is typically required to reach top speed. However, it still provides a useful indication of maximal sprinting ability within a soccer-specific context. |
|
Methods MAS was defined as the running speed at which V̇O2max was attained. Since V̇O2max was calculated using a 30-s rolling average, the midpoint of this window was used to determine the time at which V̇O2max occurred. To derive MAS as a continuous variable rather than a discrete one, the running speed was interpolated based on the elapsed time within the final stage, proportionally assigning a speed between the current and subsequent stage of the test. The MSS was defined as the highest speed recorded during the 20-meter sprint. This likely underestimates the players’ true maximum speed because a longer distance, closer to 40 meters, is typically required to reach top speed. However, it still provides a useful indication of maximal sprinting ability within a soccer-specific context. MAS and MSS were compared over the clusters identified by unsupervised machine learning (SPR, END, AVG). Additionally, linear regression analysis was used to identify the relationship between MAS and MSS. The relationships between these physical traits were quantified in terms of explained variance (R2). Subsequently, a Deming regression was employed after normalizing the physical traits to Z-scores in accordance with previous literature (van der Zwaard et al., 2018) to fit the relationship between these traits accounting for errors in both traits rather than that of the dependent variable only (as is common in simple linear regression analysis). Moreover, the average match-specific sprint performance was plotted against the MSS, while the distance covered at moderate and high intensity (MIR+HIR) during an average match was plotted against the MAS. Linear regression was used to examine these relationships and R2 was used to quantify the explained variance of physical capacity on match-specific running performance. |
|
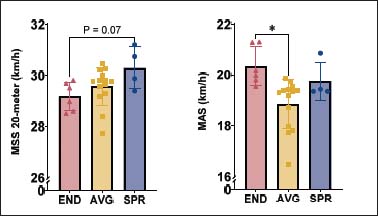
Results For our sample of young elite soccer players, the MSS over 20 meters was 29.58 ± 0.71 km/h with values ranging from 27.73 to 31.20 km/h. MAS was 19.50 ± 1.05 km/h with values ranging from 16.49 to 21.30 km/h. The three clusters identified by k-means clustering were compared for differences in MAS and MSS ( |
Figure
5. Group differences of the three clusters for their maximal 20-meter
sprint speed (MSS 20-meter) and maximal aerobic speed (MAS). See the
caption of Figure 1 and the text
for the characteristics of the three clusters: SPR, END and AVG.
|
|
|
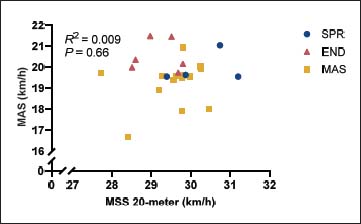
Similar to the comparison between 20-meter sprint speed and V̇O2max normalized to LBM2/3 (R2 = 0.086, P = 0.16), no (negative) relationship between MAS and MSS (R2 = 0.009, P = 0.66) was observed ( |
Figure
6. Maximal aerobic speed (MAS) plotted against the maximal
20-meter sprint speed (MSS 20-meter). Each point reflects the data of
a single young elite soccer player, for a total of 24 players. A linear
regression revealed no significant relationship between the depicted variables.
Clusters are indicated as follows: yellow square (AVG, average), red triangle
(END, endurance-oriented), and blue circle (SPR, sprint-oriented).
|
|
|
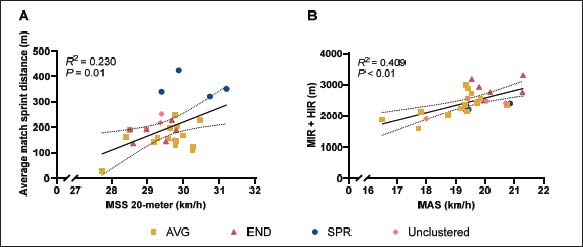
Similar to the comparison between average sprint speed and average sprint distance during a match, the linear regression showed a moderate, significant positive relationship between average sprint distance during a match and the MSS (R2 = 0.230, P = 0.01). Moreover, linear regression revealed a substantial, significant positive relationship between average match distance at moderate and high intensity and MAS (R2 = 0.409, P < 0.01) (Figure 7). |
Figure
7. (A) Average sprint distance during a match plotted against
the maximal sprint speed over a 20-meter sprint (MSS 20-meter). Each point
represents the data of a single young elite soccer player, for a total
of 27 players. Linear regression (black line) shows a moderate, significant
positive relationship between these variables. (B) Average match distance
at moderate and high intensity (14-24 km/h) plotted against maximal aerobic
speed (MAS) for 28 young elite soccer players. A substantial, significant
positive relationship was found. Clusters are indicated as follows: yellow
square (AVG, average), red triangle (END, endurance-oriented), blue circle
(SPR, sprint-oriented), and pink rhombus (insufficient data for clustering).
|
|
|
Appendix C: Alternative clustering methods |
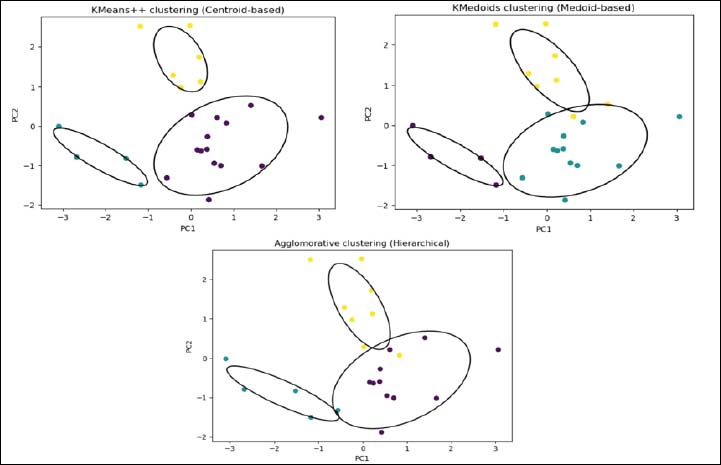
Figure
8. k-means++, k-medoids,
and hierarchical clustering as alternative clustering methods to k-means.
All three alternative methods show very similar clusters compared to k-means.
|
|