|
Supplementary Materials |
|
Supplementary Material 3. Subgroup analyses. |
|
1 VJ
|
|
1.1 PT
|
|
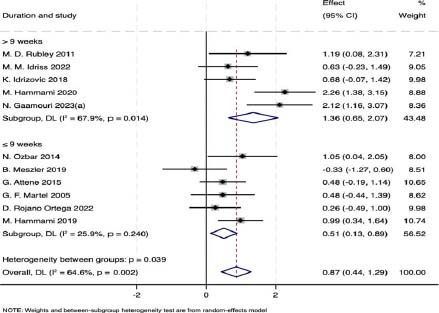
1.1.1 Training duration
|
|
Significant subgroup differences
were found in VJ performance between PT duration >9 weeks (ES: 1.36, 95%
CI: 0.65, 2.07) and ≤9 weeks (ES: 0.51, 95% CI: 0.13, 0.89) (p=0.039)
|
Figure
3.1Forest plot of the effect of
PT duration on VJ performance in female adolescent team sport athletes.
|
|
|
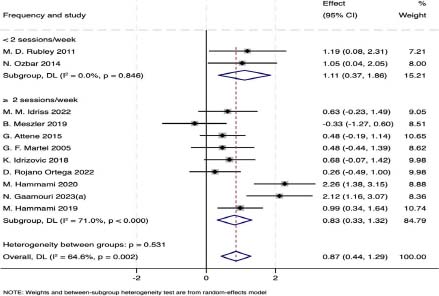
1.1.2 Training frequency
|
|
No significant subgroup differences were found in VJ performance between PT frequency <2 sessions/week (ES: 1.11, 95% CI: 0.37, 1.86) and ≥2 sessions/week (ES: 0.83, 95% CI: 0.33, 1.32) (p=0.531).
|
Figure 3.2
Forest plot of the effect of PT frequency on VJ performance in female adolescent team sport athletes.
|
|
|
1.1.2 Training frequency
|
|
No significant subgroup differences were found in VJ performance between PT frequency <2 sessions/week (ES: 1.11, 95% CI: 0.37, 1.86) and ≥2 sessions/week (ES: 0.83, 95% CI: 0.33, 1.32) (p=0.531).
|
Figure
3.2 Forest plot of the effect of
PT frequency on VJ performance in female adolescent team sport athletes.
|
|
|
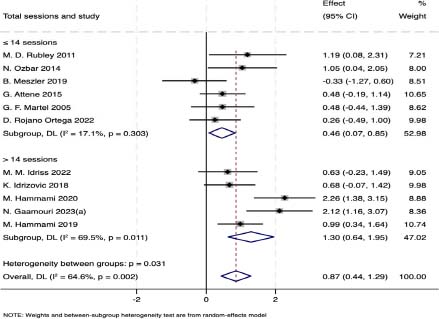
1.1.3 Total sessions
|
|
VJ performance exhibited significant subgroup differences between total PT sessions ≤14 sessions (ES: 0.46, 95% CI: 0.07, 0.85) and >14 sessions (ES: 1.30, 95% CI: 0.64, 1.95) (p=0.031).
|
Figure
3.3 Forest plot of the effect of
total PT sessions on VJ performance in female adolescent team sport athletes.
|
|
|
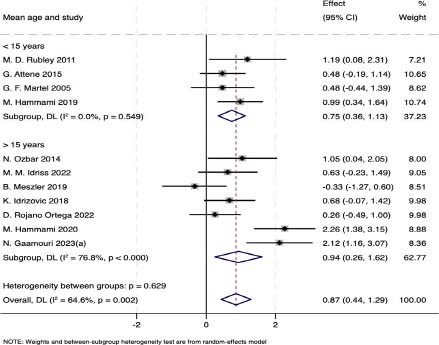
1.1.4 Age
|
|
VJ performance exhibited no significant subgroup differences between PT participants aged <15 years (ES: 0.75, 95% CI: 0.36, 1.13) and >15 years (ES: 0.94, 95% CI: 0.26, 1.62) (p=0.629).
|
Figure
3.4 Forest plot of the effect of
PT participants' age on VJ performance in female adolescent team sport
athletes.
|
|
|
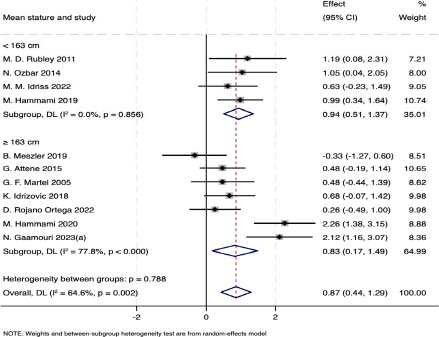
1.1.5 Height
|
|
PT participants <163 cm (ES: 0.94, 95% CI: 0.51, 1.37) and ≥163 cm (ES: 0.83, 95% CI: 0.17, 1.49) had no significant subgroup differences in VJ performance (p=0.788).
|
Figure
3.5 Forest plot of the effect of
PT participants' height on VJ performance in female adolescent team sport
athletes.
|
|
|
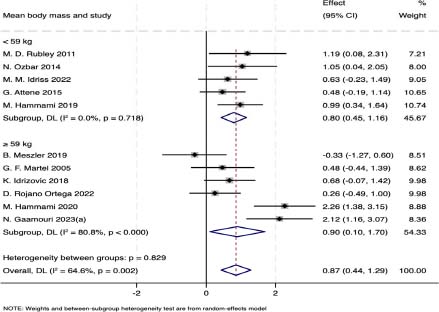
1.1.6 Weight
|
|
PT participants <59 kg (ES: 0.80, 95% CI: 0.45, 1.16) and ≥59 kg (ES: 0.90, 95% CI: 0.10, 1.70) had no significant subgroup differences in VJ performance (p=0.829).
|
Figure
3.6 Forest plot of the effect of
PT participants' weight on VJ performance in female adolescent team sport
athletes.
|
|
|
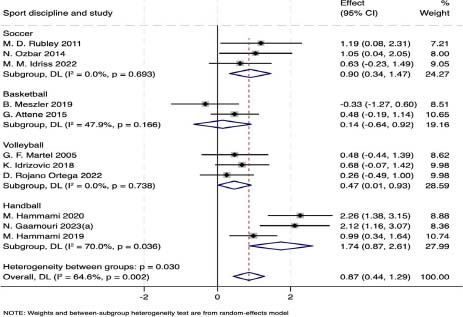
1.1.7 Type of sports
|
|
Following PT, handball players (ES: 1.74, 95% CI: 0.87, 2.61) had significant subgroup differences in VJ performance from football (ES: 0.90, 95% CI: 0.34, 1.47), basketball (ES: 0.14, 95% CI: -0.64, 0.92), and volleyball players (ES: 0.47, 95% CI: 0.01, 0.93) (p=0.030).
|
Figure
3.7 Forest plot of the effect of
type of sports on VJ performance in female adolescent team sport athletes
following PT.
|
|
|
1.1 ST
|
|
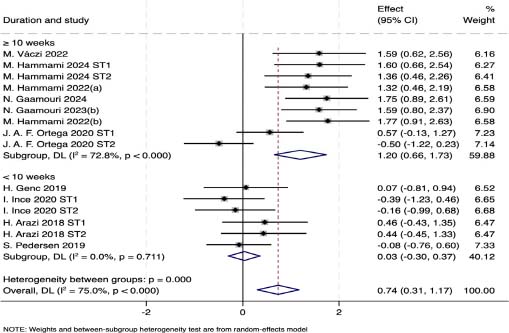
1.2.1 Training duration
|
|
Significant subgroup differences
were found in VJ performance between ST duration ≥10 weeks (ES:
1.20, 95% CI: 0.66, 1.73) and <10 weeks (ES: 0.03, 95% CI: -0.30,
0.37) (p=0.000).
|
Figure
3.8 Forest plot of the effect of
ST duration on VJ performance in female adolescent team sport athletes.
|
|
|
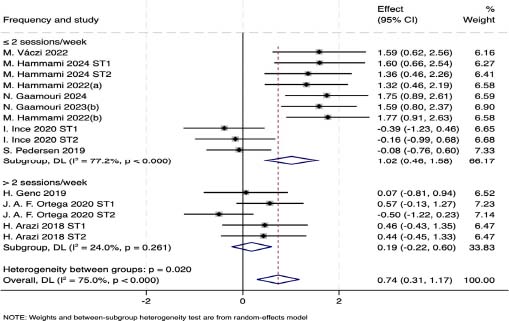
1.2.2 Training frequency
|
|
Significant subgroup differences were found in VJ performance between ST frequency ≤2 sessions/week (ES: 1.02, 95% CI: 0.46, 1.58) and >2 sessions/week (ES: 0.19, 95% CI: -0.22, 0.60) (p=0.020).
|
Figure
3.9 Forest plot of the effect of
ST frequency on VJ performance in female adolescent team sport athletes.
|
|
|
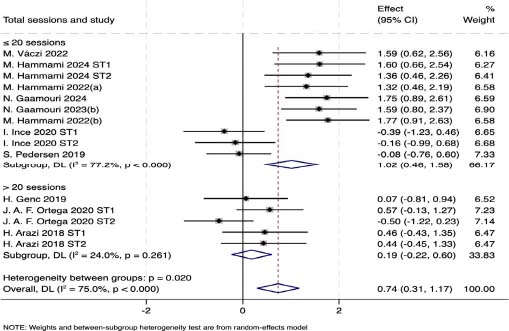
1.2.3 Total sessions
|
|
VJ performance exhibited significant subgroup differences between total ST sessions ≤20 sessions (ES: 1.02, 95% CI: 0.46, 1.58) and >20 sessions (ES: 0.19, 95% CI: -0.22, 0.60) (p=0.020).
|
Figure
3.10 Forest plot of the effect
of total ST sessions on VJ performance in female adolescent team sport
athletes.
|
|
|
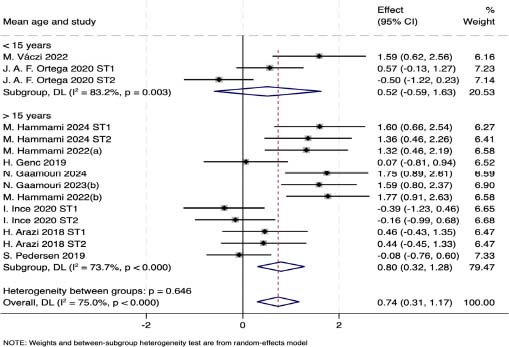
1.2.4 Age
|
|
VJ performance exhibited no significant subgroup differences between ST participants aged <15 years (ES: 0.52, 95% CI: -0.59, 1.63) and >15 years (ES: 0.80, 95% CI: 0.32, 1.28) (p=0.646).
|
Figure
3.11 Forest plot of the effect
of ST participants' age on VJ performance in female adolescent team sport
athletes.
|
|
|
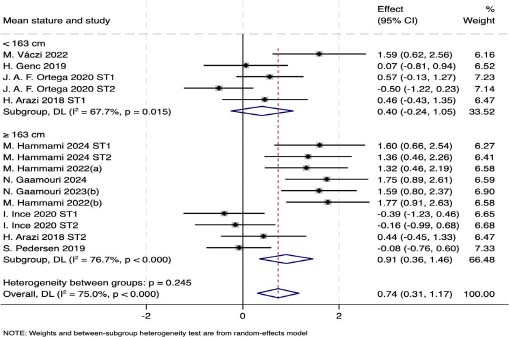
1.2.5 Height
|
|
ST participants <163 cm (ES: 0.40, 95% CI: -0.24, 1.05) and ≥163 cm (ES: 0.91, 95% CI: 0.36, 1.46) had no significant subgroup differences in VJ performance (p=0.245).
|
Figure
3.12 Forest plot of the effect
of ST participants' height on VJ performance in female adolescent team
sport athletes.
|
|
|
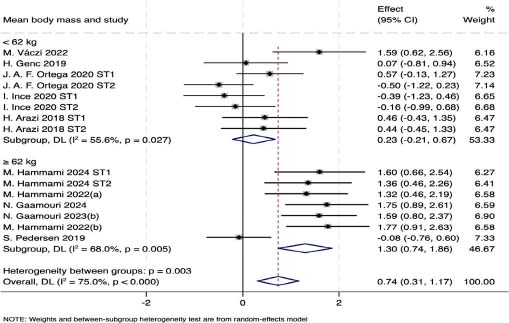
1.2.6 Weight
|
|
ST participants <62 kg (ES: 0.23, 95% CI: -0.21, 0.67) and ≥62 kg (ES: 1.30, 95% CI: 0.74, 1.86) had significant subgroup differences in VJ performance (p=0.003).
|
Figure
3.13 Forest plot of the effect
of ST participants' weight on VJ performance in female adolescent team
sport athletes.
|
|
|
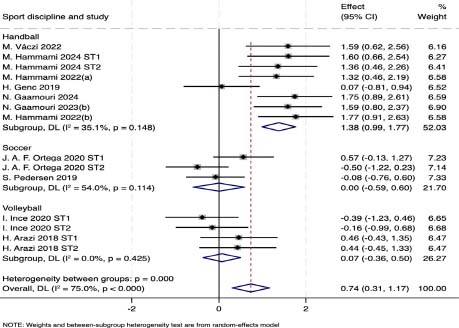
1.2.7 Type of sports
|
|
Following ST, handball players (ES: 1.38, 95% CI: 0.99, 1.77) had significant subgroup differences in VJ performance from football (ES: 0.00, 95% CI: -0.59, 0.60) and volleyball players (ES: 0.07, 95% CI: -0.36, 0.50) (p=0.000).
|
Figure
3.14 Forest plot of the effect
of type of sports on VJ performance in female adolescent team sport athletes
following ST.
|
|
|
2 LS speed
|
|
2.1 PT
|
|
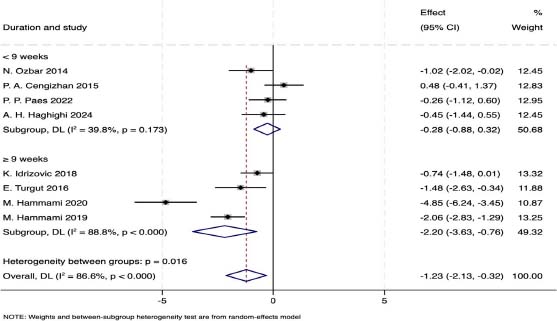
2.1.1 Training duration
|
|
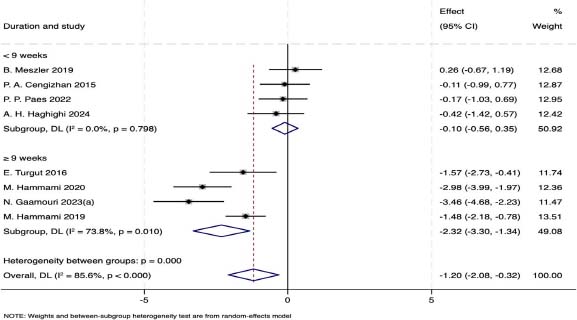
Significant subgroup differences
were found in LS speed between PT duration <9 weeks (ES: -0.28,
95% CI: -0.88, 0.32) and ≥9 weeks (ES: -2.20, 95% CI: -3.63, -0.76)
(p=0.016).
|
Figure
3.15 Forest plot of the effect
of PT duration on LS speed in female adolescent team sport athletes.
|
|
|
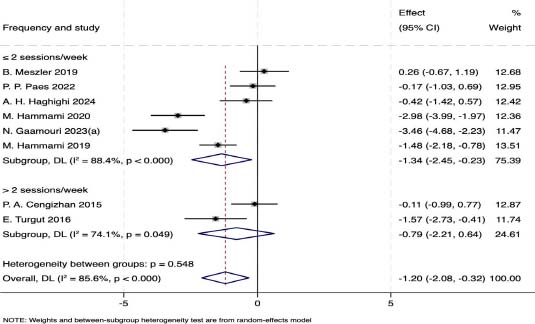
2.1.2 Training frequency
|
|
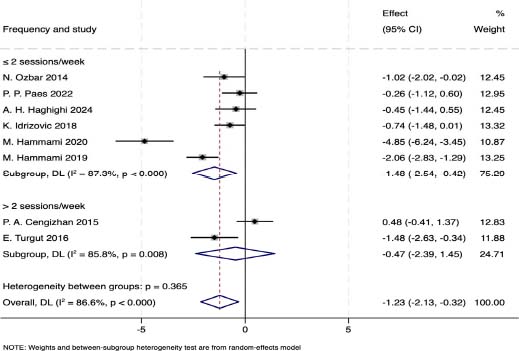
No significant subgroup differences were found in LS speed between PT frequency ≥2 sessions/week (ES: -0.47, 95% CI: -2.39, 1.45) and ≤2 sessions/week (ES: -1.48, 95% CI: -2.54, -0.42) (p=0.365).
|
Figure
3.16 Forest plot of the effect
of PT frequency on LS speed in female adolescent team sport athletes.
|
|
|
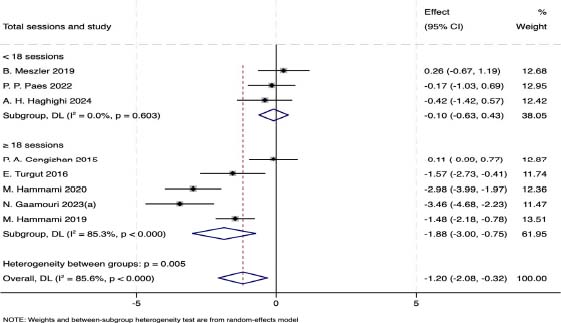
2.1.3 Total sessions
|
|
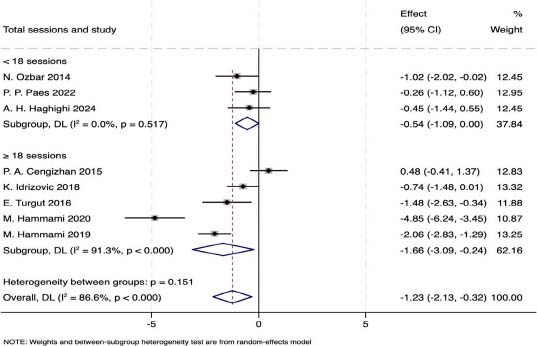
LS speed exhibited no significant subgroup differences between total PT sessions <18 sessions (ES: -0.54, 95% CI: -1.09, 0.00) and ≥18 sessions (ES: -1.66, 95% CI: -3.09, -0.24) (p=0.151).
|
Figure
3.17 Forest plot of the effect
of total PT sessions on LS speed in female adolescent team sport athletes.
|
|
|
2.1.4 Age
|
|
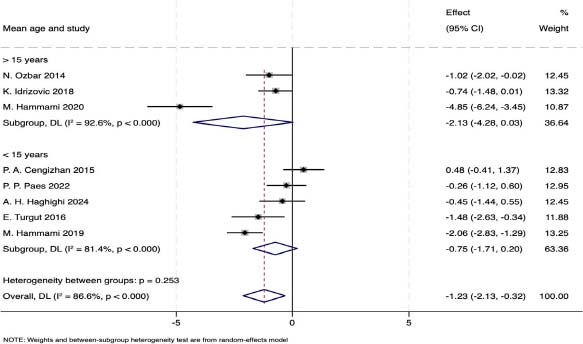
LS speed exhibited no significant subgroup differences between PT participants aged >15 years (ES: -2.13, 95% CI: -4.28, 0.03) and <15 years (ES: -0.75, 95% CI: -1.71, 0.20) (p=0.253).
|
Figure
3.18 Forest plot of the effect
of PT participants' age on LS speed in female adolescent team sport athletes.
|
|
|
2.1.5 Height
|
|
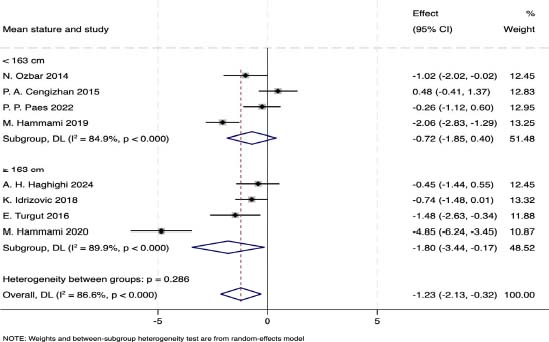
PT participants <163 cm (ES: -0.72, 95% CI: -1.85, 0.40) and ≥163 cm (ES: -1.80, 95% CI: -3.44, -0.17) had no significant subgroup differences in LS speed (p=0.286).
|
Figure
3.19 Forest plot of the effect
of PT participants' height on LS speed in female adolescent team sport
athletes.
|
|
|
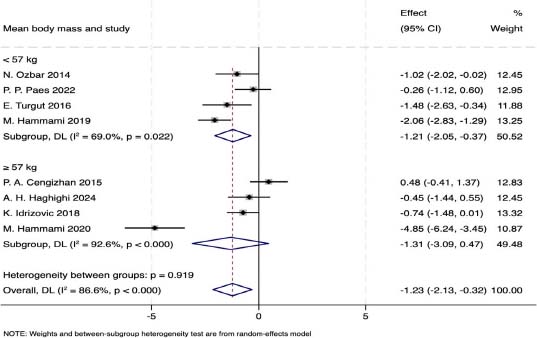
2.1.6 Weight
|
|
PT participants <57 kg (ES: -1.21, 95% CI: -2.05, -0.37) and ≥57 kg (ES: -1.31, 95% CI: -3.09, 0.47) had no significant subgroup differences in LS speed (p=0.919).
|
Figure
3.20 Forest plot of the effect
of PT participants' weight on LS speed in female adolescent team sport
athletes.
|
|
|
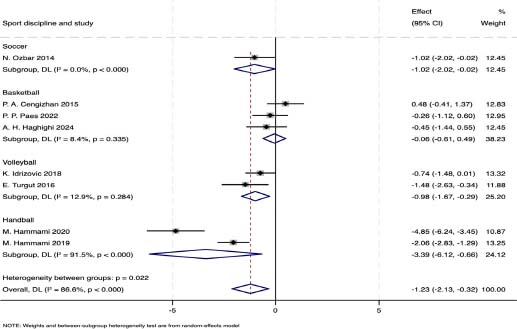
2.1.7 Type of sports
|
|
Following PT, handball players (ES: -3.39, 95% CI: -6.12, -0.66) had significant subgroup differences in LS speed from football (ES: -1.02, 95% CI: -2.02, -0.02), basketball (ES: -0.06, 95% CI: -0.61, 0.49), and volleyball players (ES: -0.98, 95% CI: -1.67, -0.29) (p=0.022).
|
Figure
3.21 Forest plot of the effect
of type of sports on LS speed in female adolescent team sport athletes
following PT.
|
|
|
2.2 ST
|
|
2.2.1 Training duration
|
|
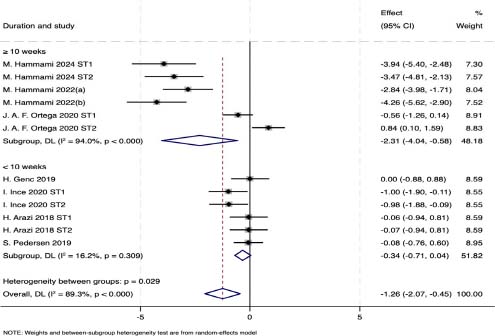
Significant subgroup differences
were found in LS speed between ST duration ≥10 weeks (ES: -2.31,
95% CI: -4.04, -0.58) and <10 weeks (ES: -0.34, 95% CI: -0.71,
0.04) (p=0.029).
|
Figure
3.22 Forest plot of the effect
of ST duration on LS speed in female adolescent team sport athletes.
|
|
|
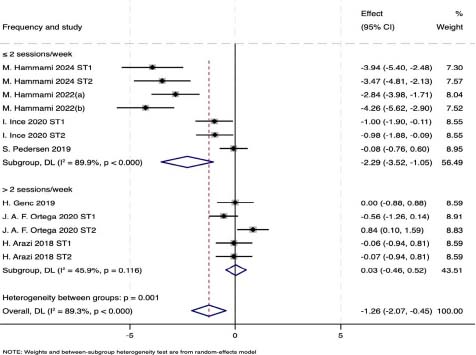
2.2.2 Training frequency
|
|
Significant subgroup differences were found in LS speed between ST frequency ≤2 sessions/week (ES: -2.29, 95% CI: -3.52, -1.05) and >2 sessions/week (ES: 0.03, 95% CI: -0.46, 0.52) (p=0.001).
|
Figure
3.23 Forest plot of the effect
of ST frequency on LS speed in female adolescent team sport athletes.
|
|
|
2.2.3 Total sessions
|
|
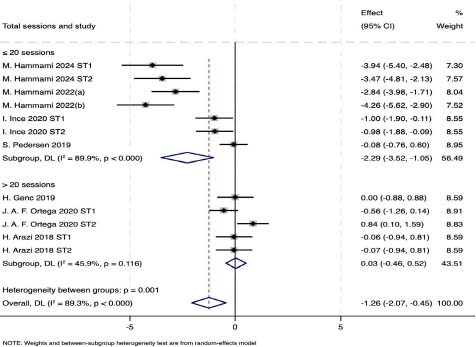
LS speed exhibited significant subgroup differences between total ST sessions ≤20 sessions (ES: -2.29, 95% CI: -3.52, -1.05) and >20 sessions (ES: 0.03, 95% CI: -0.46, 0.52) (p=0.001).
|
Figure
3.24 Forest plot of the effect
of total ST sessions on LS speed in female adolescent team sport athletes.
|
|
|
2.2.4 Age
|
|
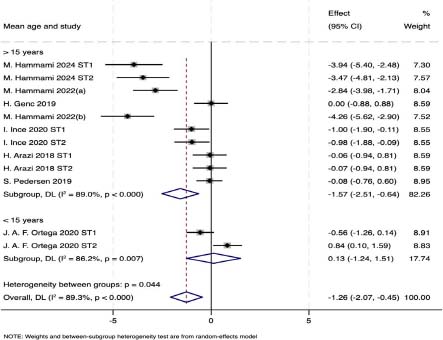
LS speed exhibited significant subgroup differences between ST participants aged >15 years (ES: -1.57, 95% CI: -2.51, -0.64) and <15 years (ES: 0.13, 95% CI: -1.24, 1.51) (p=0.044).
|
Figure
3.25 Forest plot of the effect
of ST participants' age on LS speed in female adolescent team sport athletes.
|
|
|
2.2.5 Height
|
|
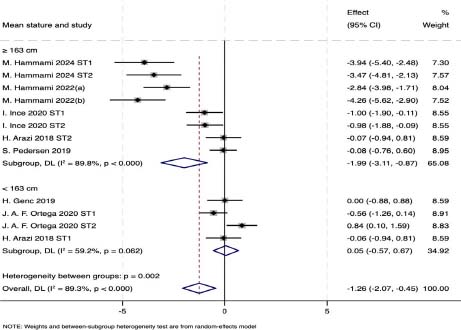
ST participants ≥163 cm (ES: -1.99, 95% CI: -3.11, -0.87) and <163 cm (ES: 0.05, 95% CI: -0.57, 0.67) had significant subgroup differences in LS speed (p=0.002).
|
Figure
3.26 Forest plot of the effect
of ST participants' height on LS speed in female adolescent team sport
athletes.
|
|
|
2.2.6 Weight
|
|
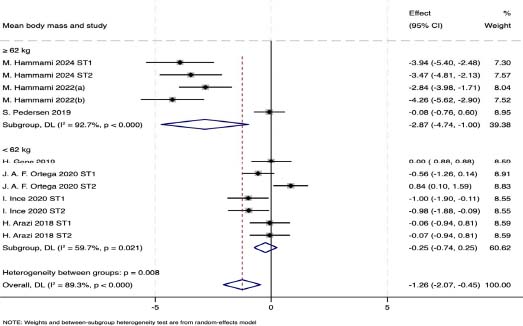
ST participants ≥62 kg (ES: -2.87, 95% CI: -4.74, -1.00) and <62 kg (ES: -0.25, 95% CI: -0.74, 0.25) had significant subgroup differences in LS speed (p=0.008).
|
Figure
3.27 Forest plot of the effect
of ST participants' weight on LS speed in female adolescent team sport
athletes.
|
|
|
2.2.7 Type of sports
|
|
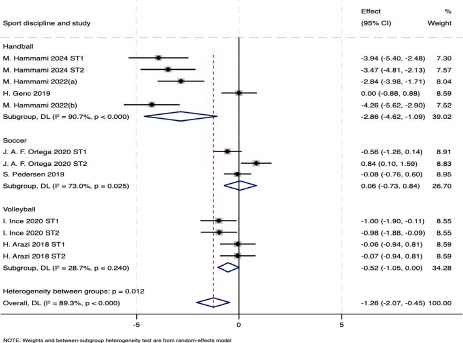
Following ST, handball players (ES: -2.86, 95% CI: -4.62, -1.09) had significant subgroup differences in LS speed from football (ES: 0.06, 95% CI: -0.73, 0.84) and volleyball players (ES: -0.52, 95% CI: -1.05, 0.00) (p=0.012).
|
Figure
3.28 Forest plot of the effect
of type of sports on LS speed in female adolescent team sport athletes
following ST.
|
|
|
3 COD speed
|
|
3.1 PT
|
|
3.1.1 Training duration
|
|
Significant subgroup differences
were found in COD speed between PT duration <9 weeks (ES: -0.10,
95% CI: -0.56, 0.35) and ≥9 weeks (ES: -2.32, 95% CI: -3.30, -1.34)
(p=0.000).
|
Figure
3.29 Forest plot of the effect
of PT duration on COD speed in female adolescent team sport athletes.
|
|
|
3.1.2 Training frequency
|
|
No significant subgroup differences were found in COD speed between PT frequency ≤2 sessions/week (ES: -1.34, 95% CI: -2.45, -0.23) and >2 sessions/week (ES: -0.79, 95% CI: -2.21, 0.64) (p=0.548).
|
Figure
3.30 Forest plot of the effect
of PT frequency on COD speed in female adolescent team sport athletes.
|
|
|
3.1.3 Total sessions
|
|
COD speed exhibited significant subgroup differences between total PT sessions <18 sessions (ES: -0.10, 95% CI: -0.63, 0.43) and ≥18 sessions (ES: -1.88, 95% CI: -3.00, -0.75) (p=0.005).
|
Figure
3.31 Forest plot of the effect
of total PT sessions on COD speed in female adolescent team sport athletes.
|
|
|
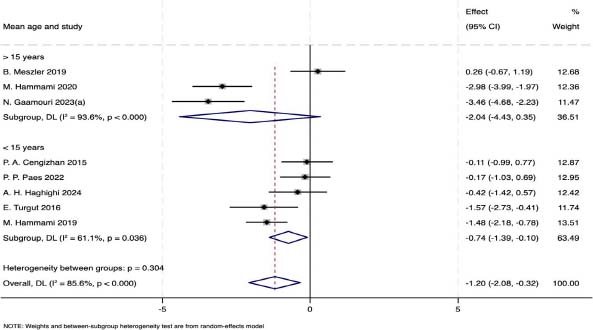
3.1.4 Age
|
|
COD speed exhibited no significant subgroup differences between PT participants aged >15 years (ES: -2.04, 95% CI: -4.43, 0.35) and <15 years (ES: -0.74, 95% CI: -1.39, -0.10) (p=0.304).
|
Figure
3.32 Forest plot of the effect
of PT participants' age on COD speed in female adolescent team sport athletes.
|
|
|
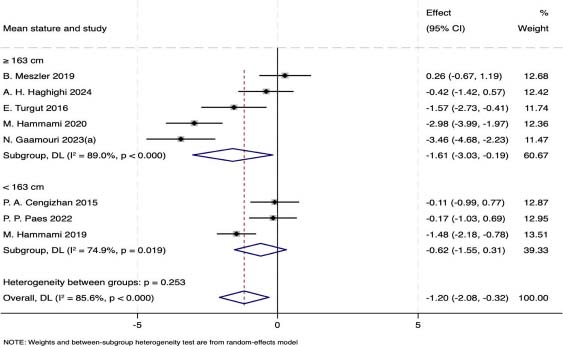
3.1.5 Height
|
|
PT participants ≥163 cm (ES: -1.61, 95% CI: -3.03, -0.19) and <163 cm (ES: -0.62, 95% CI: -1.55, 0.31) had no significant subgroup differences in COD speed (p=0.253).
|
Figure
3.33 Forest plot of the effect
of PT participants' height on COD speed in female adolescent team sport
athletes.
|
|
|
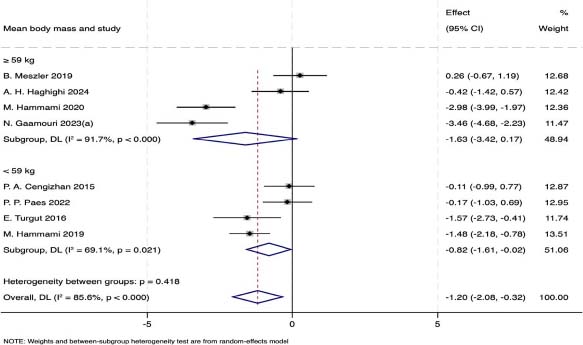
3.1.6 Weight
|
|
PT participants ≥59 kg (ES: -1.63, 95% CI: -3.42, 0.17) and <59 kg (ES: -0.82, 95% CI: -1.61, -0.02) had no significant subgroup differences in COD speed (p=0.418).
|
Figure
3.34 Forest plot of the effect
of PT participants' weight on COD speed in female adolescent team sport
athletes.
|
|
|
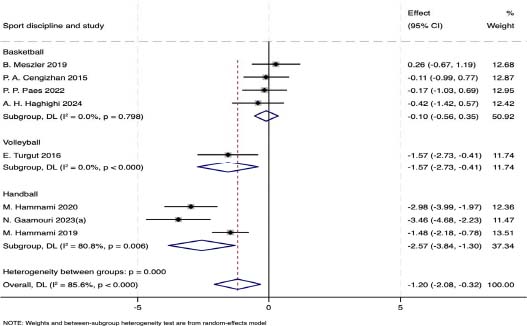
3.1.7 Type of sports
|
|
Following PT, handball players (ES: -2.57, 95% CI: -3.84, -1.30) had significant subgroup differences in COD speed from basketball (ES: -0.10, 95% CI: -0.56, 0.35) and volleyball players (ES: -1.57, 95% CI: -2.73, -0.41) (p=0.000).
|
Figure
3.35 Forest plot of the effect
of type of sports on COD speed in female adolescent team sport athletes
following PT.
|
|
|
3.1 ST
|
|
3.2.1 Training duration
|
|
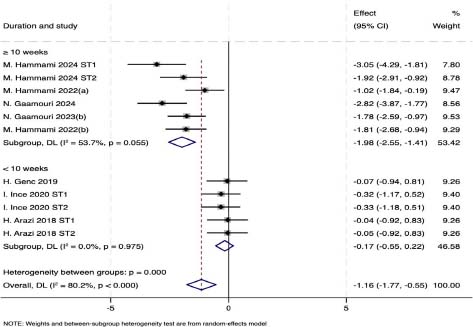
Significant subgroup differences
were found in COD speed between ST duration ≥10 weeks (ES: -1.98,
95% CI: -2.55, -1.41) and <10 weeks (ES: -0.17, 95% CI: -0.55,
0.22) (p=0.000).
|
Figure
3.36 Forest plot of the effect
of ST duration on COD speed in female adolescent team sport athletes.
|
|
|
3.2.2 Training frequency
|
|
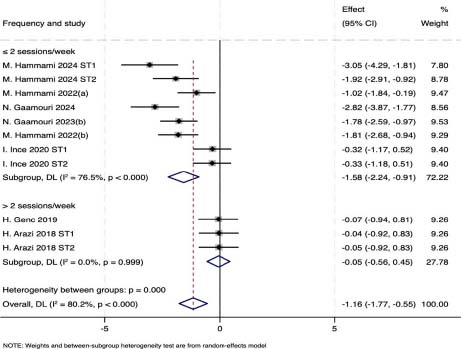
Significant subgroup differences were found in COD speed between ST frequency ≤2 sessions/week (ES: -1.58, 95% CI: -2.24, -0.91) and >2 sessions/week (ES: -0.05, 95% CI: -0.56, 0.45) (p=0.000).
|
Figure
3.37 Forest plot of the effect
of ST frequency on COD speed in female adolescent team sport athletes.
|
|
|
3.2.3 Total sessions
|
|
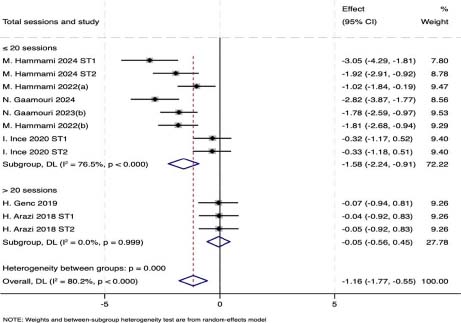
COD speed exhibited significant subgroup differences between total ST sessions ≤20 sessions (ES: -1.58, 95% CI: -2.24, -0.91) and >20 sessions (ES: -0.05, 95% CI: -0.56, 0.45) (p=0.000).
|
Figure
3.38 Forest plot of the effect
of total ST sessions on COD speed in female adolescent team sport athletes.
|
|
|
3.2.4 Age (>15 years, no grouping)
|
|
3.2.5 Height
|
|
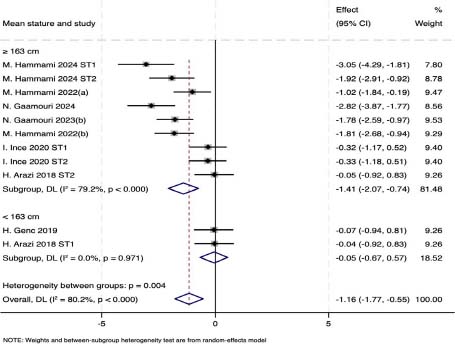
ST participants ≥163 cm (ES: -1.41, 95% CI: -2.07, -0.74) and <163 cm (ES: -0.05, 95% CI: -0.67, 0.57) had significant subgroup differences in COD speed (p=0.004).
|
Figure
3.39 Forest plot of the effect
of ST participants' height on COD speed in female adolescent team sport
athletes.
|
|
|
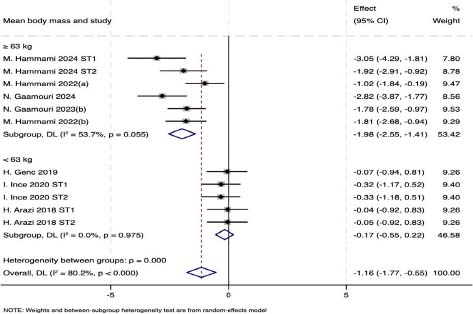
3.2.6 Weight
|
|
ST participants ≥63 kg (ES: -1.98, 95% CI: -2.55, -1.41) and <63 kg (ES: -0.17, 95% CI: -0.55, 0.22) had significant subgroup differences in COD speed (p=0.000).
|
Figure
3.40 Forest plot of the effect
of ST participants' weight on COD speed in female adolescent team sport
athletes.
|
|
|
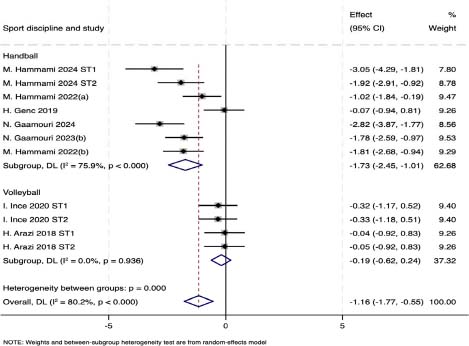
3.2.7 Type of sports
|
|
Following ST, handball players (ES: -1.73, 95% CI: -2.45, -1.01) had significant subgroup differences in COD speed from volleyball players (ES: -0.19, 95% CI: -0.62, 0.24) (p=0.000).
|
Figure
3.41 Forest plot of the effect
of type of sports on COD speed in female adolescent team sport athletes
following ST.
|
|