 |
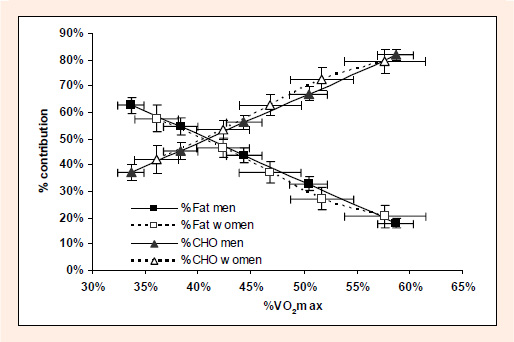
Figure 3.
Percent Fat and carbohydrate (CHO) contribution to the energy expenditure at each stage of the treadmill test for men and women, and peak fat oxidation rates (as %fat), plotted against the relative exercise intensity (%VO). Values are mean± SE