 |
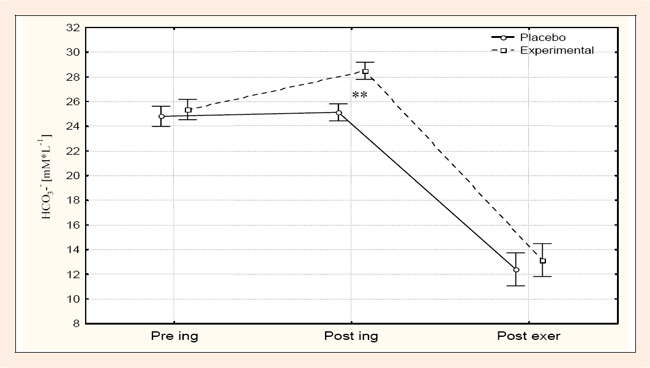
Figure 2.
Blood bicarbonate (HCO3-) levels in the pre and post ingestion as well as post exercise states for the placebo and experimental trials. ** statistically significant difference in the post ingestion state between the placebo and sodium bicarbonate trial (p < 0.001).