 |
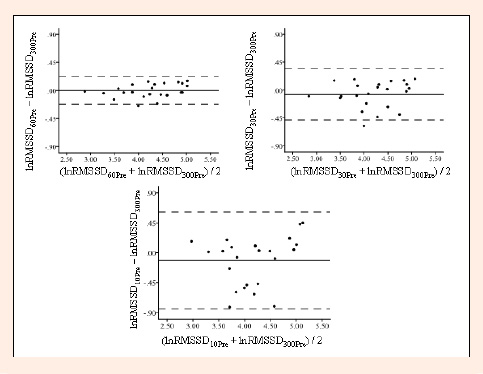
Figure 1.
Bland-Altman plots comparing the ultra-short-term and criterion pre-exercise log transformed root mean square of successive R-R interval differences (lnRMSSD).The solid line represents the mean difference and the 2 outside dashed lines represent the upper and lower limits of agreement (± 1.96 SD of the mean difference).