 |
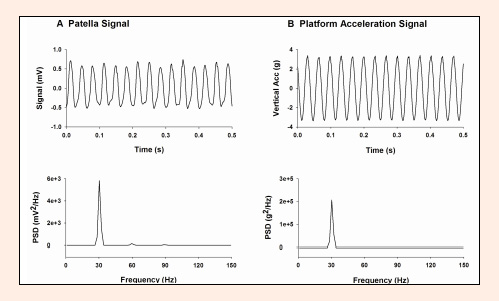
Figure 2.
Example of (A) an electrical signal recorded on the patella and of (B) a vertical platform acceleration signal illustrated in the time domain (upper panel) and Power Spectral Density (PSD, lower panel) for one representative subject. The ratio  for the patella signal illustrated in (A) was γ = 0.80.