 |
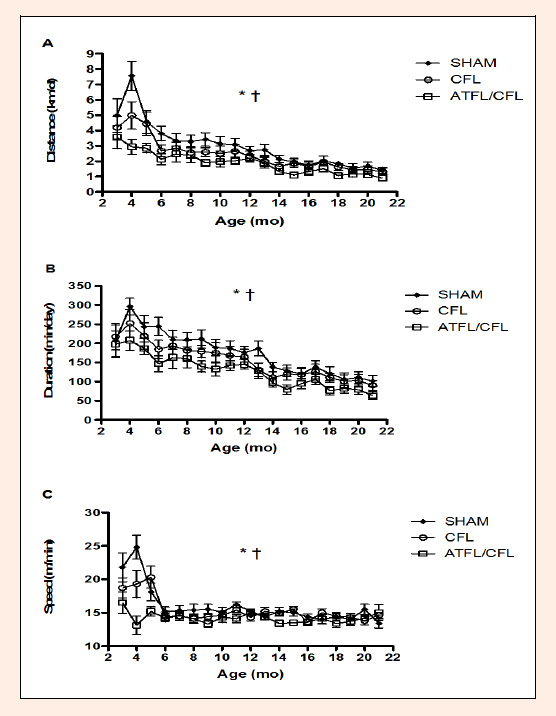
Figure 1.
A. Mean (± SD) daily distance, B. daily duration, and C. average running speed for the three running wheel groups across the lifespan. * denotes significant difference between groups and † denotes significant difference with age (p<0.05).