 |
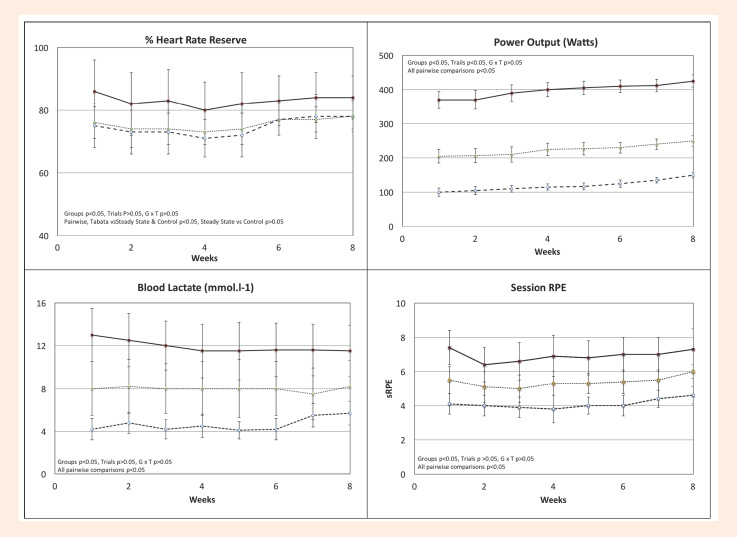
Figure 1.
Acute responses (mean ±sd) during training in the three experimental groups (circles=steady state, triangles=Meyer, Squares=Tabata) across the training program. Power output in the HIIT groups is expressed as Watts during the loaded segments.