 |
Figure 2.
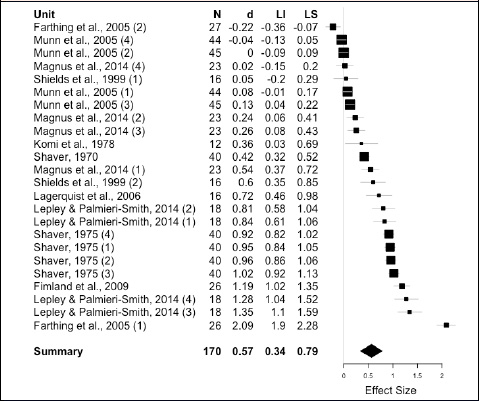
Forest plot of Cohen’s d in each unit of analysis. * Sample size, N; effect size, d; limits of confidence interval inferior, LI, and superior, LS.
|
|
|
Figure 2.
Forest plot of Cohen’s d in each unit of analysis. * Sample size, N; effect size, d; limits of confidence interval inferior, LI, and superior, LS.
|