 |
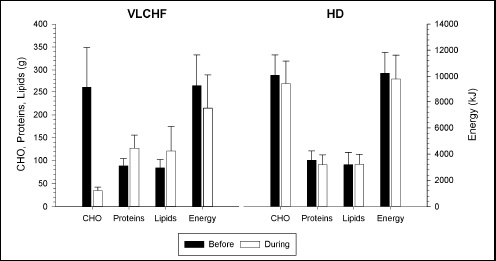
Figure 1.
Dietary characteristics across the 5-day recordings before the intervention started (black bars) and during the 4-week experimental period (white bars) in the very low-carbohydrate high-fat diet (VLCHF) and high carbohydrate (HD) groups. Values are expressed as mean ± standard deviation.