 |
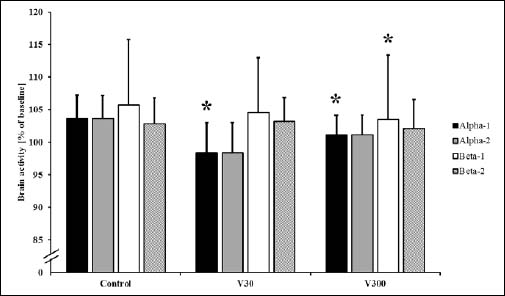
Figure 4.
Electroencephalographic brain activity during the different conditions relative to baseline. V30 refers to 30 s and V300 to 300 s of local vibration. * indicates significant difference from the same cortical power spectrum during control condition (p < 0.05).