 |
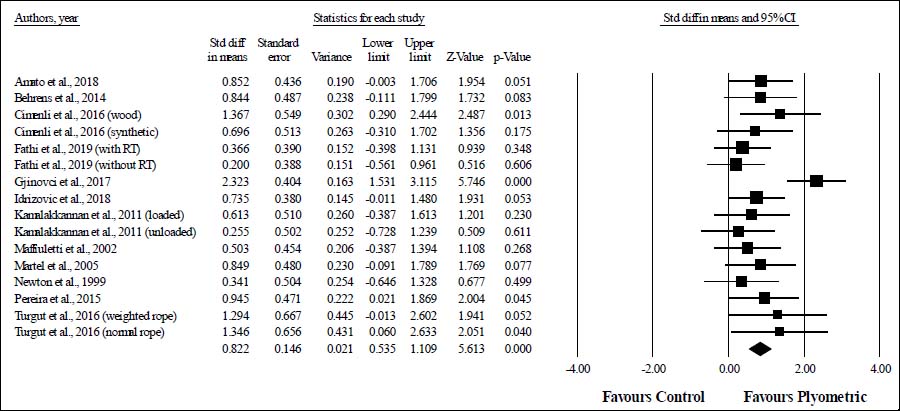
Figure 2.
Forest plot of increases in vertical jump height (muscular power) in volleyball players participating in plyometric jump training compared to controls. Values shown are effect sizes with 95% confidence intervals (CI). Std diff: standard difference.