 |
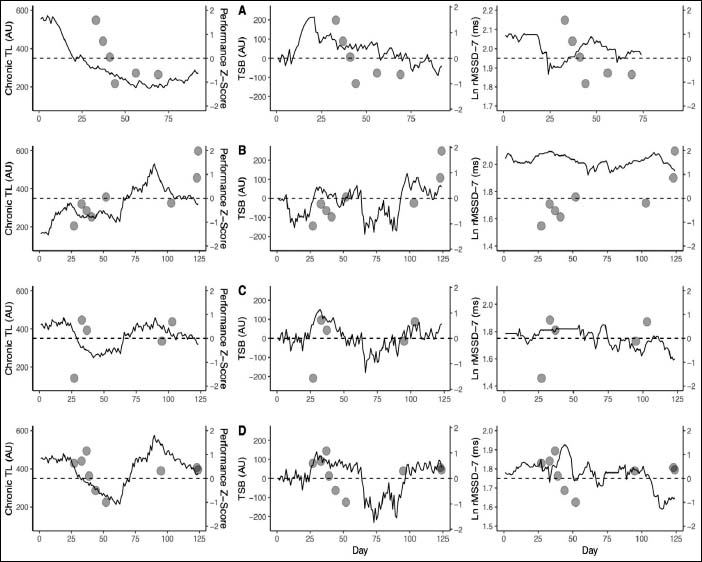
Figure 1.
A time series of chronic training load, training stress balance, heart rate variability and performances (as z-scores) for four elite international long jump athletes prior and during the 2016 Olympic Games. The chronic training load, training stress balance and heart rate variability time series are indicated by the solid line whereas the performances (as z-scores) are indicated by the circular points. TL – training load, TSB – training stress balance, AU – arbitrary units, LnRMSSD-7 - natural logarithm of the square of the mean sum of the squared differences between R-R intervals averaged over 7 days, ms – milliseconds.