 |
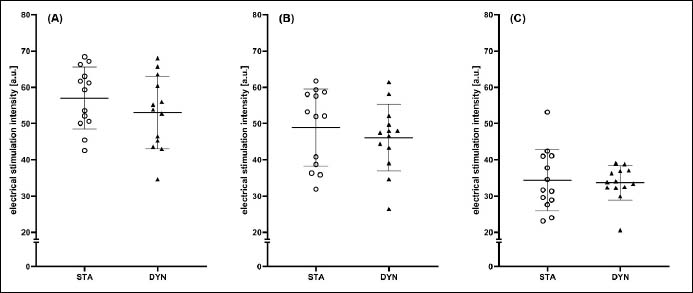
Figure 2.
Mean stimulation intensity of the thighs (A), glutei (B) and the upper body (C) during each WB-EMS session for all participants of the static (STA, circles) and dynamic training group (DYN, triangles). Furthermore, group mean values and standard deviations are indicated additionally.