 |
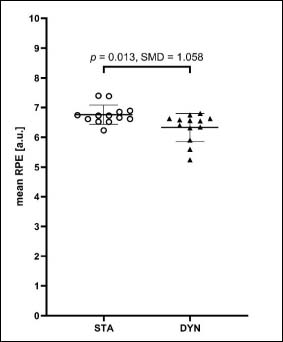
Figure 3.
Mean perceived effort of each WB-EMS session for all participants of the static (STA, circles) and dynamic training group (DYN, triangles). Furthermore, mean values and standard deviations, p-values of the independent t-test and standardized mean differences (SMD) are indicated additionally.