 |
Figure 2.
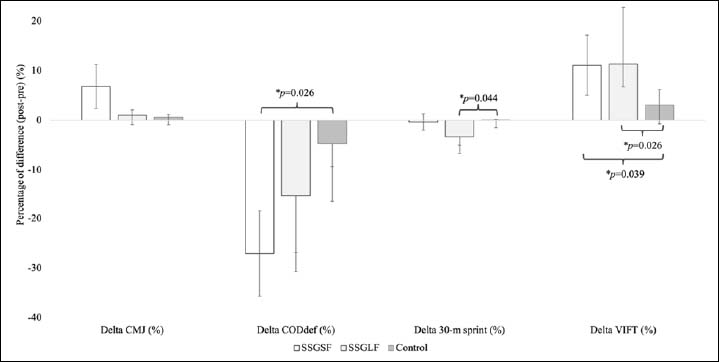
Percentage difference for the observed measures. *: significantly different between groups (p < 0.05).
|
|
|
Figure 2.
Percentage difference for the observed measures. *: significantly different between groups (p < 0.05).
|