 |
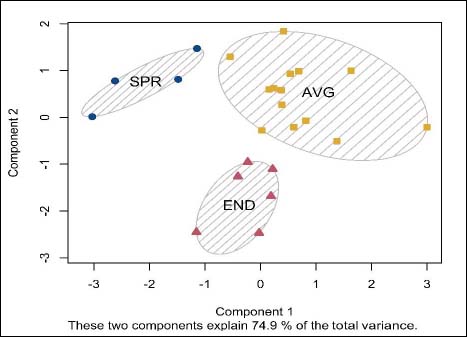
Figure 1.
Cluster plot with a two-dimensional representation of the three identified clusters. Clusters are displayed in the two most important principal component dimensions (together explaining 74.9 % of the total variance). The dimensions in question are based on the combined distance traveled at moderate and high intensity (MIR + HIR), match-specific sprint distance, normalized V̇O2max, and average 20-meter sprint speed. Individual values and spanning ellipses of clusters are presented for SPR, which is a cluster with high sprint capacity and a large number of meters sprinted during the match (n = 4), for END, which is a group of players with high endurance capacity and a large number of meters ran at moderate and high intensity (n = 6), and for AVG, which is a group of players who either do not possess a high physical capacity or do not have a matching high match-specific running performance (n = 14). See text for further details.