 |
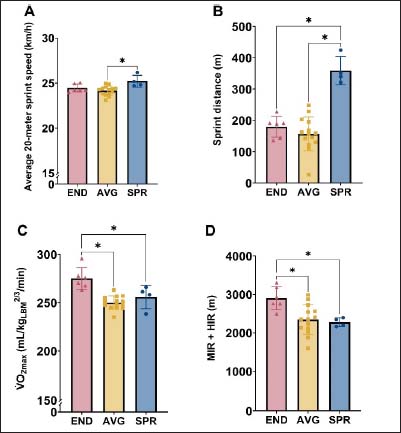
Figure 2.
Group differences of the three clusters for their average match sprint distance, average 20-meter sprint speed, average match distance covered at moderate and high intensity, normalized V̇O2max. See the caption of Figure 1 and the text for the characteristics of the three clusters: SPR, END and AVG.