 |
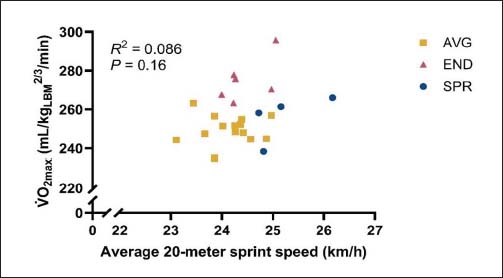
Figure 3.
Normalized V̇O2max plotted against the average 20-meter sprint speed. Each point reflects the data of a single young elite soccer player, for a total of 24 players. A linear regression revealed no significant relationship between the depicted variables. Clusters are indicated as follows: yellow square (AVG, average), red triangle (END, endurance-oriented), and blue circle (SPR, sprint-oriented).