 |
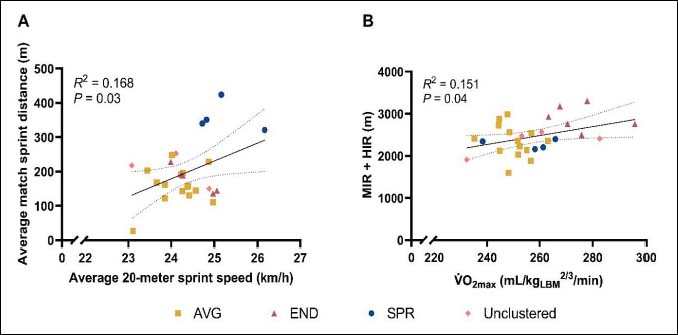
Figure 4.
(A) Average sprint distance during a match plotted against the average sprint speed over a 20-meter sprint. Each point represents the data of a single young elite soccer player, for a total of 27 players. Linear regression (black line) shows a moderate, significant positive relationship between these variables. Clusters are indicated as follows: yellow square (AVG, average), red triangle (END, endurance-oriented), blue circle (SPR, sprint-oriented), and pink rhombus (insufficient data for clustering). (B) Average match distance at moderate and high intensity (14-24 km/h) plotted against normalized V̇O2max for 28 young elite soccer players. As in (A), a moderate, significant positive relationship was found.