 |
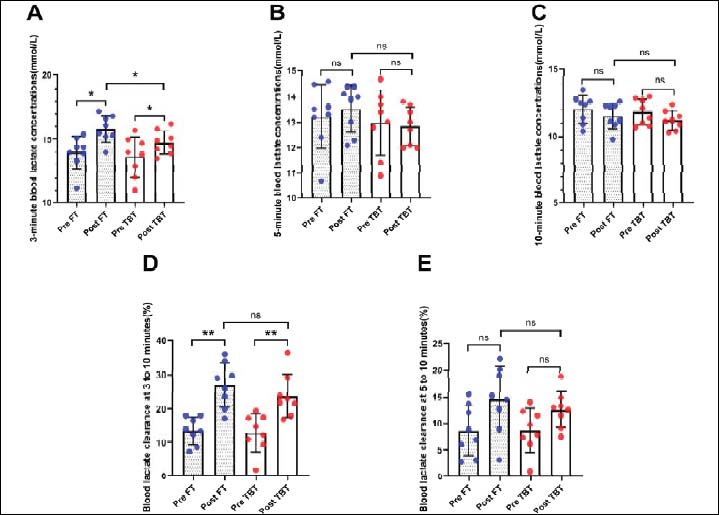
Figure 2.
The graphs compare the pre- and post-intervention blood lactate concentration within the flywheel eccentric training (blue) and traditional barbell training (red) groups, respectively, as well as the post-intervention significance of the two groups. Each point corresponds to an individual athlete. Panels A, B, and C show the blood lactate concentration at 3, 5, and 10 minutes, respectively. Panels D and E display blood lactate clearance at 3-10 and 5-10 minutes. Data are presented as means ± standard deviation (M ± SD).