 |
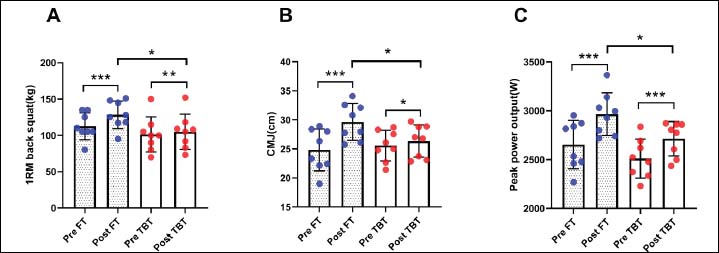
Figure 4.
The graphs compare the pre- and post-intervention lower limb strength within the flywheel eccentric training and traditional barbell training groups, respectively, as well as the post-experimental significance of the two groups. The flywheel eccentric training group is shown in blue and the traditional barbell training group is shown in red, with each point corresponding to an individual athlete. Panel A is the 1RM back squat, Panel B is the CMJ, and Panel C is the peak power output. Data are presented as means ± standard deviation (M ± SD).