 |
Figure 1.
Boxplots of speed (A), stroke rate (B), stroke length (C) and jerk cost (D) by 50 m laps across 400 m and categorized by performance groups. * p < 0.05, ** p < 0.01, *** p < 0.001, **** p < 0.0001.
|
|
|
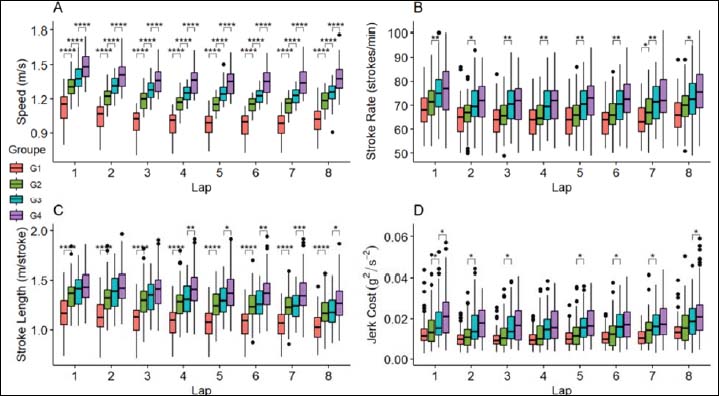
Figure 1.
Boxplots of speed (A), stroke rate (B), stroke length (C) and jerk cost (D) by 50 m laps across 400 m and categorized by performance groups. * p < 0.05, ** p < 0.01, *** p < 0.001, **** p < 0.0001.
|