 |
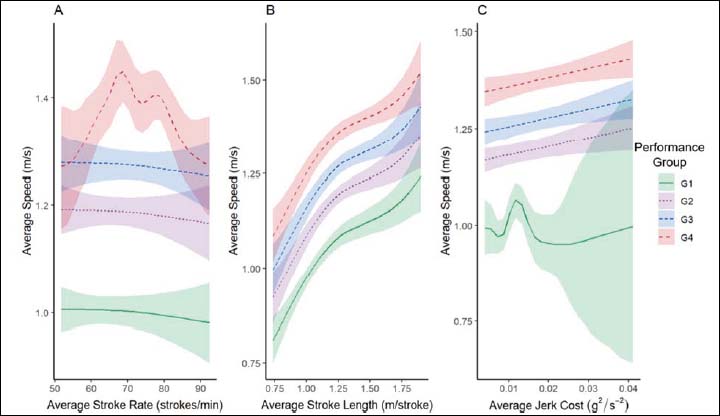
Figure 2.
Relationships between final performance (i.e., average speed over the 400 m) and mean stroke mechanics (i.e., average stroke rate (panel A), average stroke length (panel B) and average jerk cost (panel C)) for each performance group, based on the summed effects of the fitted HGAMs.