 |
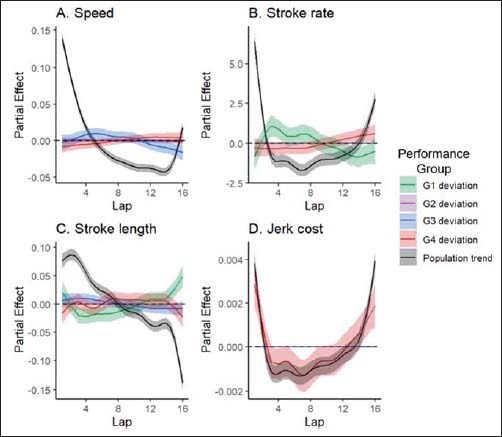
Figure 3.
Common population trends and specific deviation functions by performance group for the regulation of pacing (panel A) and stroke mechanics (i.e., stroke rate (panel B), stroke length (panel C), and jerk cost (panel D)) across the 400 m, based on the partial effects of the fitted HGAMs.