 |
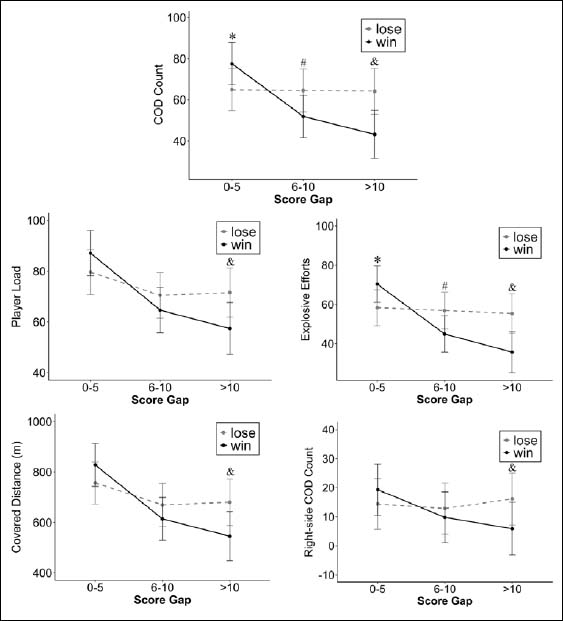
Figure 1.
Pairwise comparisons of load variables between winners and losers across different score gap categories (0–5, 6–10, >10 points). Data presented as Estimated Marginal Means ± 95% Confidence Intervals. *Adjusted p < 0.05 between winners and losers under 0-5 score gap; # Adjusted p < 0.05 between winers and losers under 6-10 score gap; & Adjusted p < 0.05 between winers and losers under >10 score gap.