 |
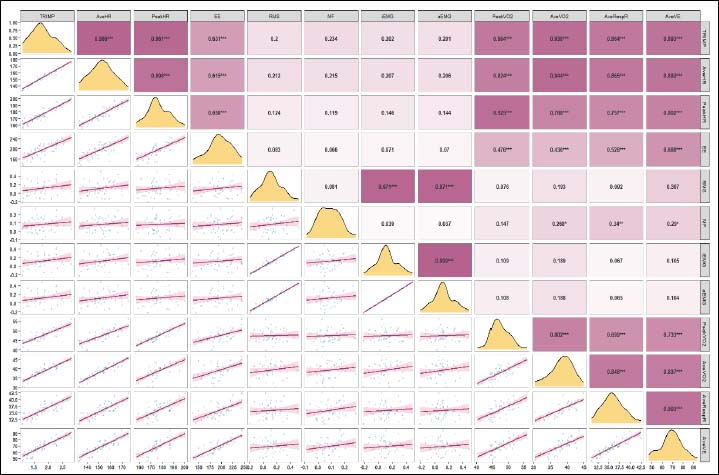
Figure 2.
Pairwise correlations among internal load indicators, respiratory-metabolic variables, and biceps femoris (BF) electromyographic (EMG) parameters. The upper triangle displays Spearman’s correlation coefficients, where color intensity indicates the strength of correlation, with (*** p < 0.001), (** p < 0.01), and (*p <0.05) denoting statistical significance. The lower triangle presents scatter plots with overlaid linear regression lines, visualizing pairwise linear trends. Diagonal panels show kernel density plots, representing the distribution of each variable. Variables include training impulse per minute (TRIMP), average and peak heart rate (AveHR, PeakHR), total energy expenditure (EE), rectus femoris EMG indices [root mean square (RMS), mean frequency (MF), integrated EMG (iEMG), and average EMG amplitude (aEMG)], and respiratory parameters [peak oxygen uptake (PeakVO2), average oxygen uptake (AveVO2), average respiratory exchange ratio (AveRespR), and average ventilation (AveVE)].