 |
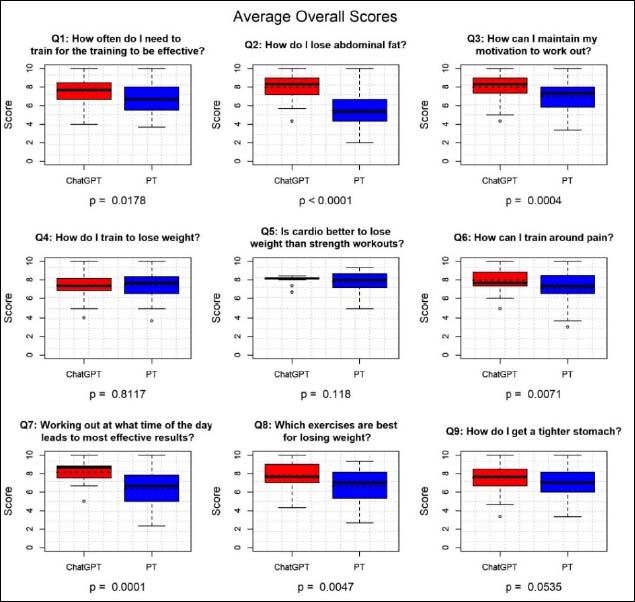
Figure 2.
Overall grades for the answers to the questions given by ChatGPT (green, left) and PTs (blue, right). The upper and lower bounds of the boxplots present the interquartile range, the red dotted line inside the box represents the average, and the black solid line represents the median of the data. The upper and lower lines beyond the box (whiskers) are the highest and lowest values, respectively, excluding outliers.