 |
Figure 1.
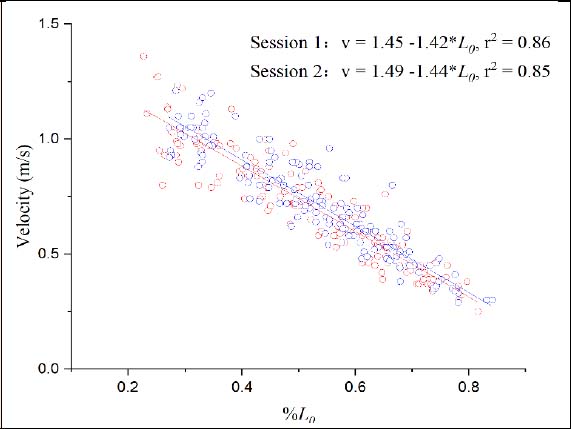
The load-velocity relationship in different sessions (red line and point for Session 1, blue line and point for Session 2).
|
|
|
Figure 1.
The load-velocity relationship in different sessions (red line and point for Session 1, blue line and point for Session 2).
|