 |
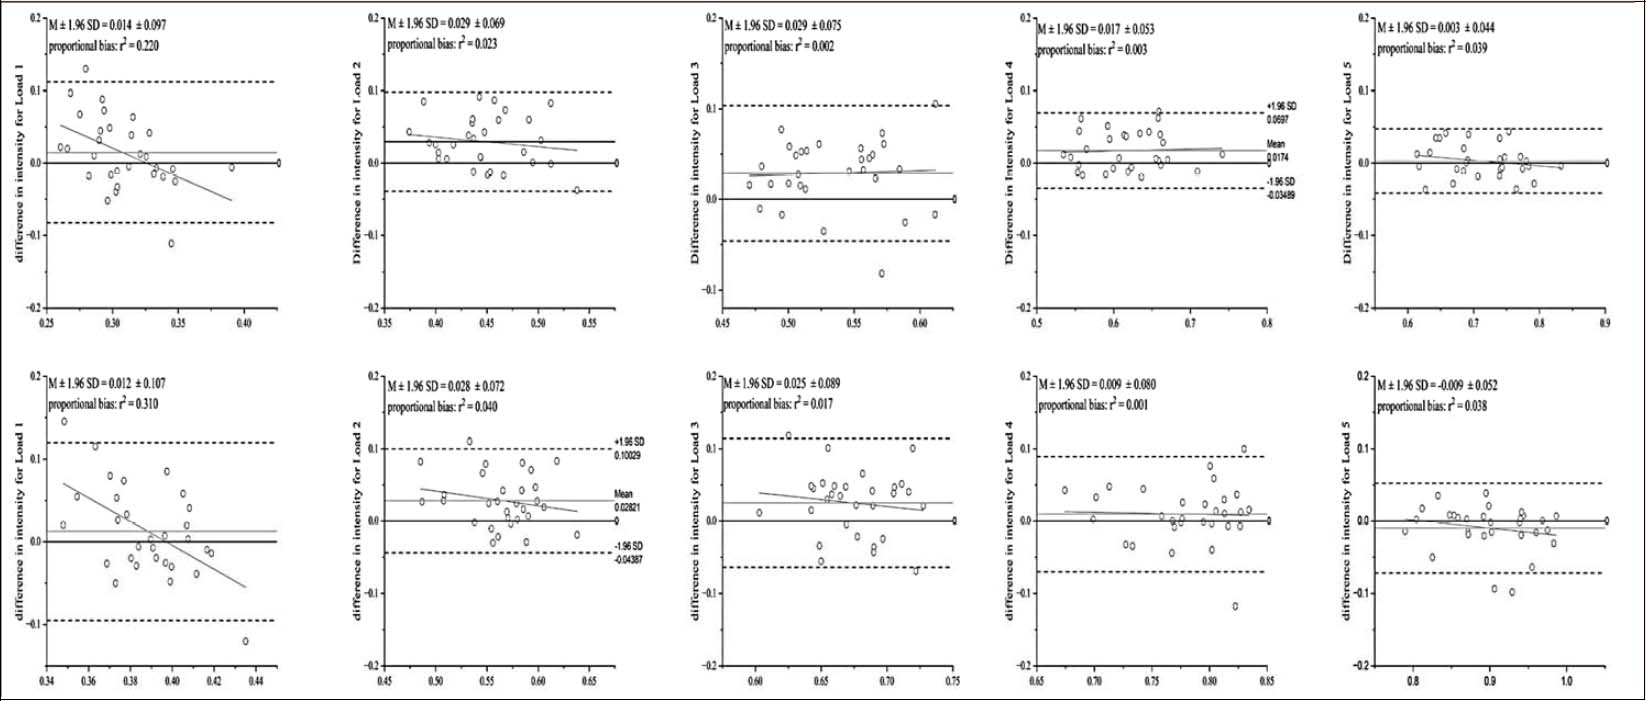
Figure 3.
Bland-Altman plots illustrating the agreement between predicted and actual loads for the %1RM-MV relationship (upper panel) and the %L0-MV relationship (lower panel) across progressively increasing load intensities (left to right). L0, load-intercept; 1RM, one repetition maximum; R2, coefficient of determination.