 |
Figure 10.
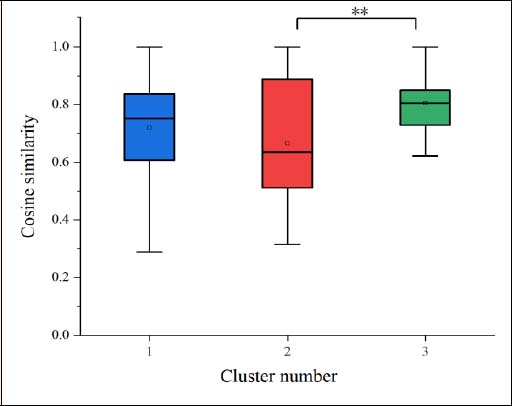
The inter-individual similarity of temporal activation patterns within the three clusters during the stroke. **p < 0.01.
|
|
|
Figure 10.
The inter-individual similarity of temporal activation patterns within the three clusters during the stroke. **p < 0.01.
|