 |
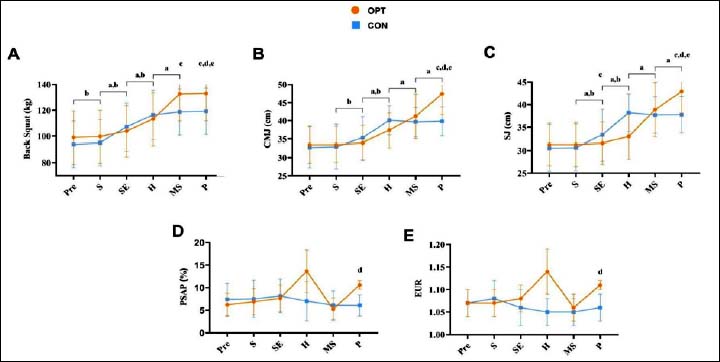
Figure 3.
Changes in 1RM (A), CMJ (B), SJ (C), PSAP (D), and EUR (E) across training phases. OPT (n = 21) and CON (n = 21). Data are mean ± SD; pre = pre-intervention; S = Stabilization phase; SE = Strength Endurance phase; H = Hypertrophy phase; MS = Maximal Strength phase; P = Power phase. (a) indicates a significant difference relative to the previous phase within the OPT group; (b) indicates a significant difference relative to the previous phase within the CON group; (c) indicates a significant difference between OPT and CON; (d) indicates a significant pre-post difference within the OPT group; (e) indicates a significant pre-post difference within the CON group.