 |
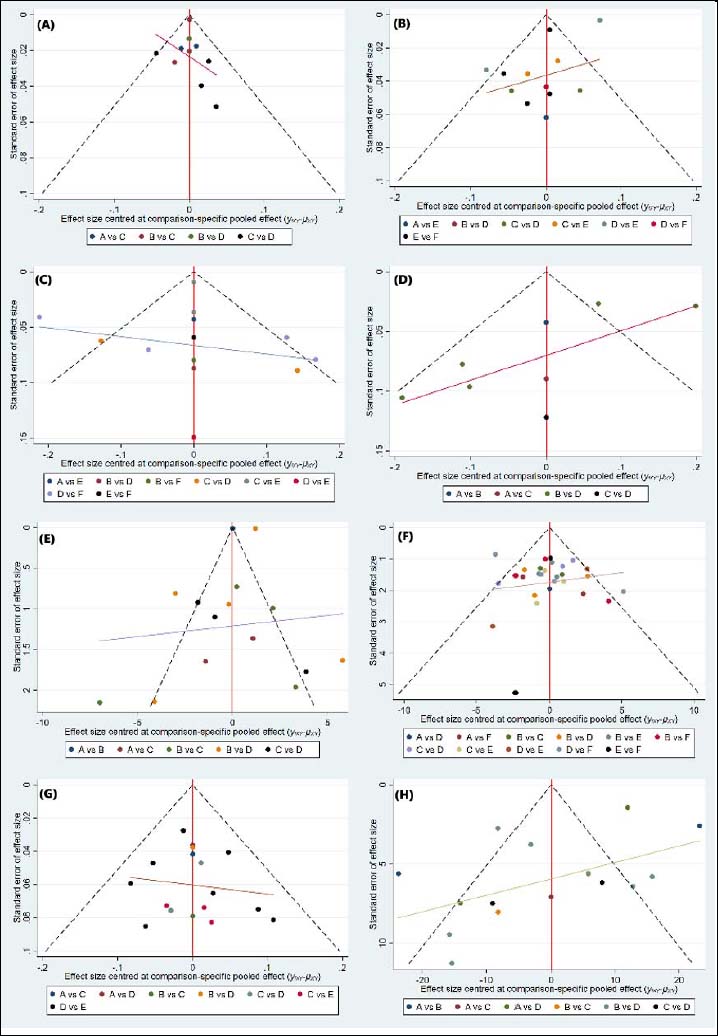
Figure 10.
Funnel plot of publication bias. (A) 5 m sprint; (B) 20 m sprint; (C) 30 m sprint; (D) 40 m sprint; (E) SJ test; (F) CMJ test; (G) COD test; (H) 1RM test.
|
|
|
Figure 10.
Funnel plot of publication bias. (A) 5 m sprint; (B) 20 m sprint; (C) 30 m sprint; (D) 40 m sprint; (E) SJ test; (F) CMJ test; (G) COD test; (H) 1RM test.
|