 |
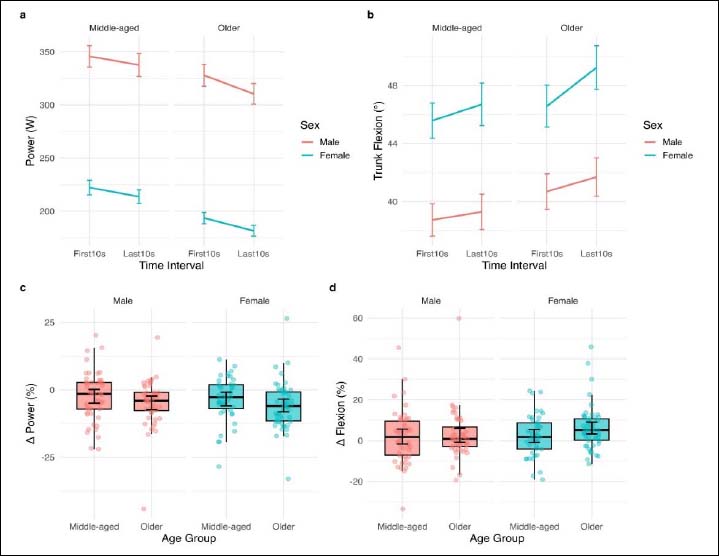
Figure 1.
Absolute (upper panels) and relative (lower panels) changes in mean power and trunk flexion during the 30-s sit-to-stand test (30sSTS). Panels a and b show absolute changes in mean power (a) and trunk flexion (b) from the first to the last 10 s of the 30STS for middle-aged and older males and females. Panels c and d show relative (%) changes in mean power (c) and trunk flexion (d). Error bars represent standard errors. Bars indicate group means ± standard deviations with individual data points overlaid; antennae represent standard errors. Mean power significantly declined over time and was lower in females and older adults compared with males and middle-aged adults, respectively (all p < 0.05), whereas trunk flexion significantly increased over time and was greater in females than in males (all p < 0.05). No interaction effects were detected.