 |
Figure 2.
Distribution of power fatigability categories (≤5%, 5–10%, 10–20%, >20% decline) for middle-aged and older adults.
|
|
|
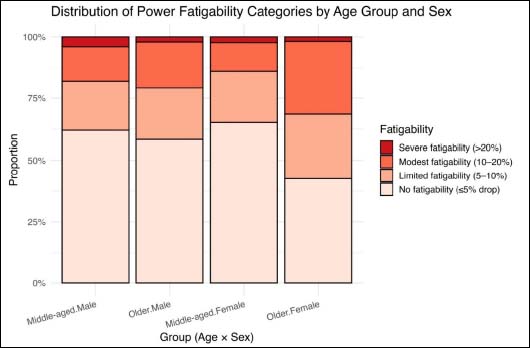
Figure 2.
Distribution of power fatigability categories (≤5%, 5–10%, 10–20%, >20% decline) for middle-aged and older adults.
|