 |
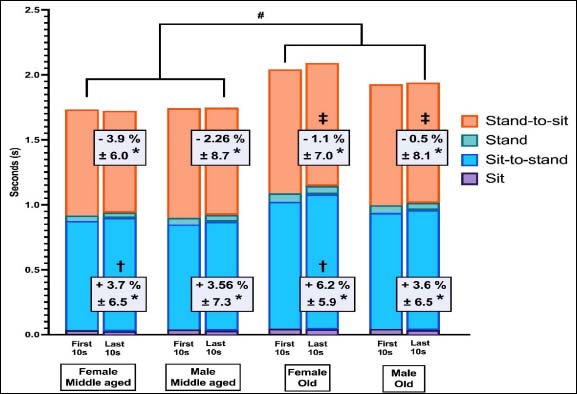
Figure 3.
Mean durations of the four sit-to-stand sub-phases during the first and last 10s of the 30-second sit-to-stand test by age group and sex. Bars represent mean phase durations (s); mean percentage change ± SD is displayed on the Sit-to-Stand and Stand-to-Sit bars, as those changes over time were significant at p < 0.05 (indicated with *); #all subphase durations were significantly longer in older versus middle-aged adults (p < 0.05); †Sit-to-Stand duration was significantly longer in females versus males (p < 0.05). ‡ a significant time-by-age interaction was observed for stand-to-sit duration (p < 0.05).