 |
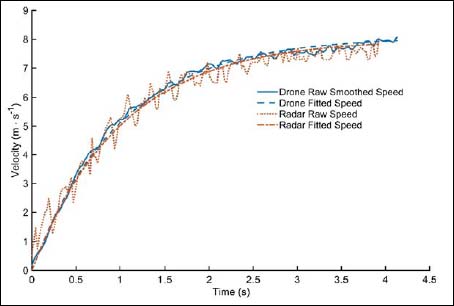
Figure 3.
Velocity curves comparison over time from the drone system (blue lines) and the radar device (orange-red lines). For each device, raw speed data are shown by solid/dotted lines, and fitted data by dashed/dash-dotted lines, respectively. The data is presented up to the point of maximal velocity achievement. Thus, the endpoint of the curve corresponds to Vmax.