 |
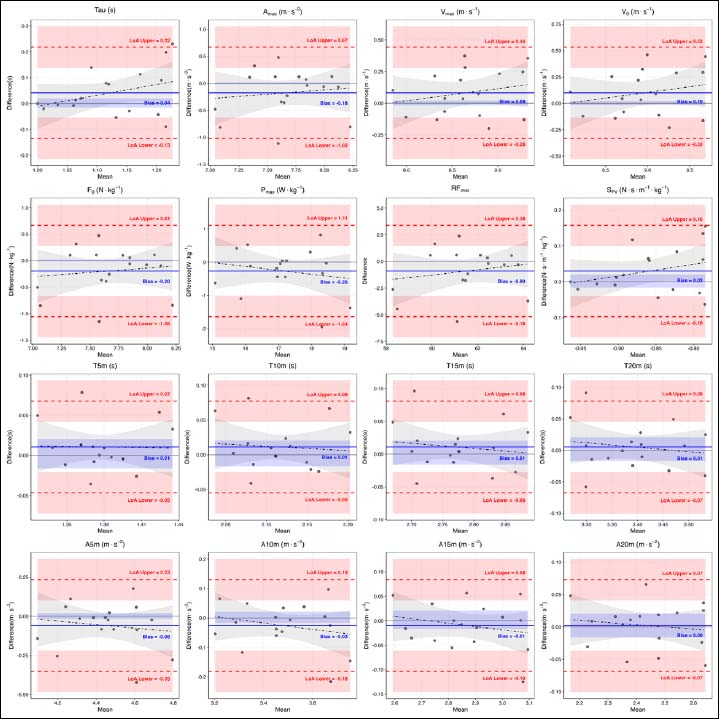
Figure 5.
Bland-Altman plots evaluating the concurrent validity and limits of agreement between the drone and radar measurement systems. The solid blue line represents the mean systematic bias, and the dashed red lines indicate the upper and lower 95% limits of agreement (LoA).