 |
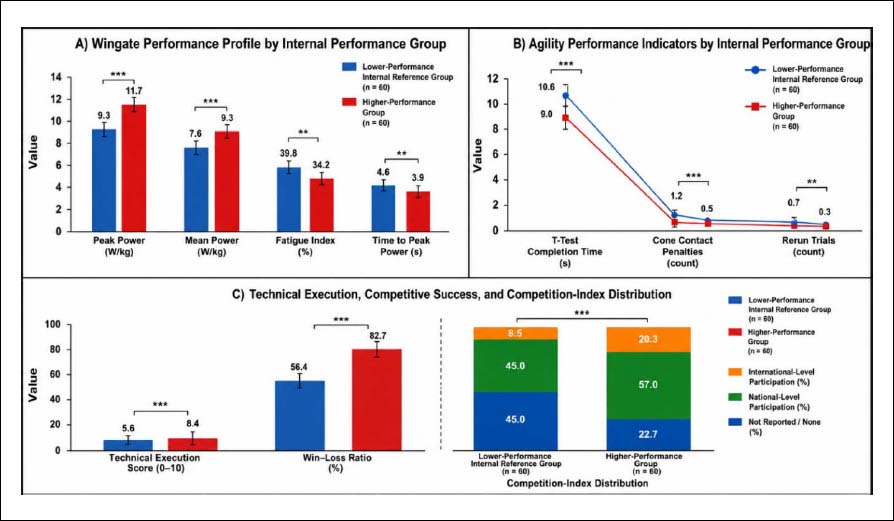
Figure 2.
A) Wingate peak power, mean power, fatigue index, and time to peak power by internal performance group; B) T-test completion time, cone contact penalties, and rerun trials by internal performance group; C) technical execution score, win-loss ratio, and competition-index distribution across the lower-performance internal reference group and higher-performance group.