 |
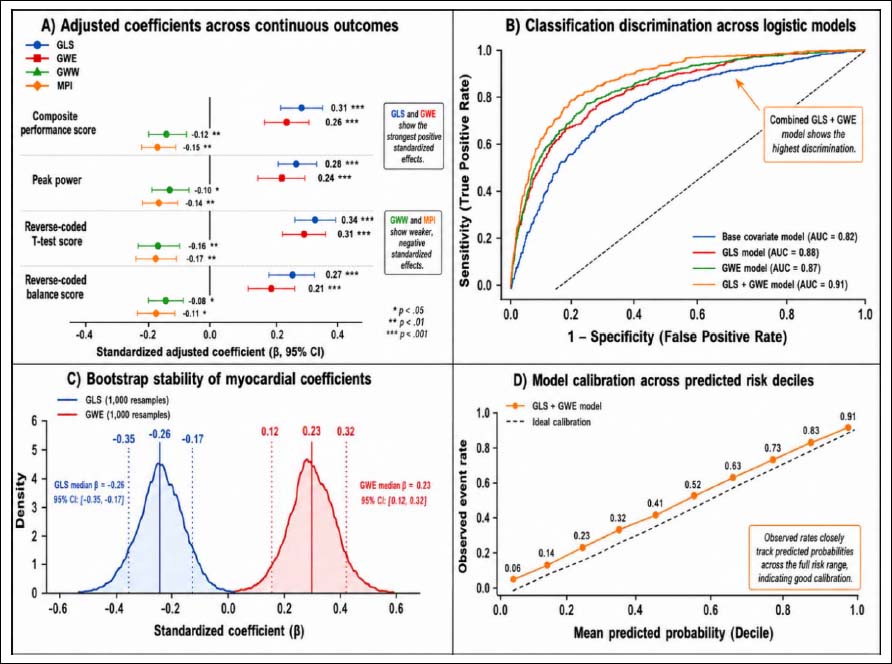
Figure 5.
A) Adjusted linear regression coefficients for GLS, GWE, GWW, and MPI across continuous performance outcomes; B) ROC curves for the base model, GLS model, GWE model, and combined GLS plus GWE model; C) bootstrap distribution of standardized GLS and GWE coefficients across 1,000 resamples; D) model calibration plot for higher-performance versus lower-performance classification.