 |
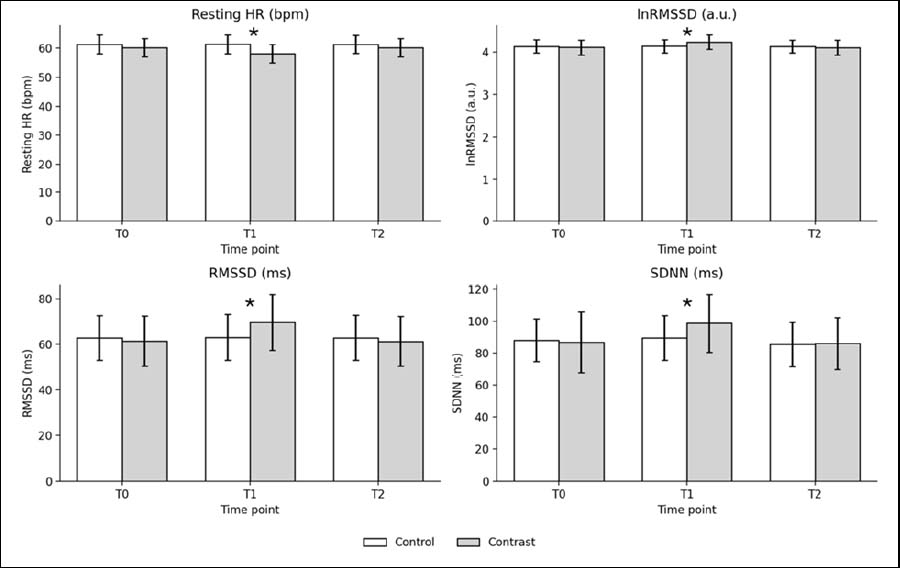
Figure 3.
Resting HRV outcomes across time points. Bars show mean values and error bars show SD. Control and contrast heat–cold groups are displayed side-by-side at each time point (T0 baseline, T1 post-intervention, T2 post wash-out). lnRMSSD, natural logarithm of the root mean square of successive differences; RMSSD, root mean square of successive differences; SDNN, standard deviation of NN intervals; *: indicates a significant between-group difference in change for a given timepoint (p < 0.05).