 |
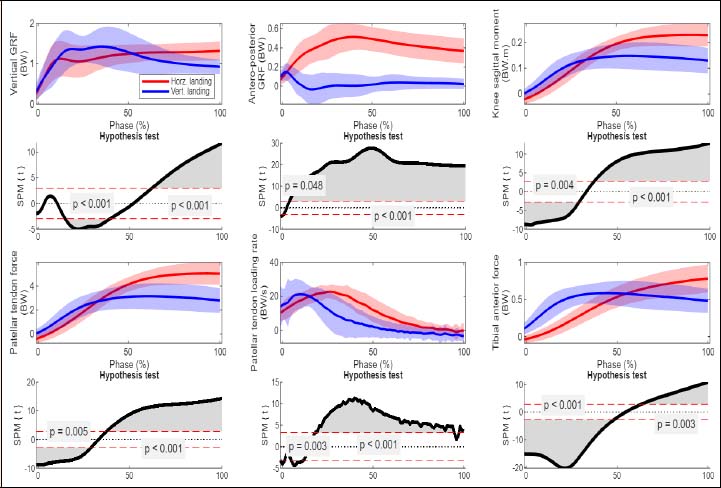
Figure 3.
Vertical and anterior ground reaction forces, knee joint moment in the sagittal plane, the patellar tendon force and loading rate, and the tibial anterior shear force during a horizontal landing (red) and a vertical landing (blue). Statistical Parametric Mapping (SPM) statistics are presented on the graphs below the time series, statistical differences are indicated by the grey shaded areas.