 |
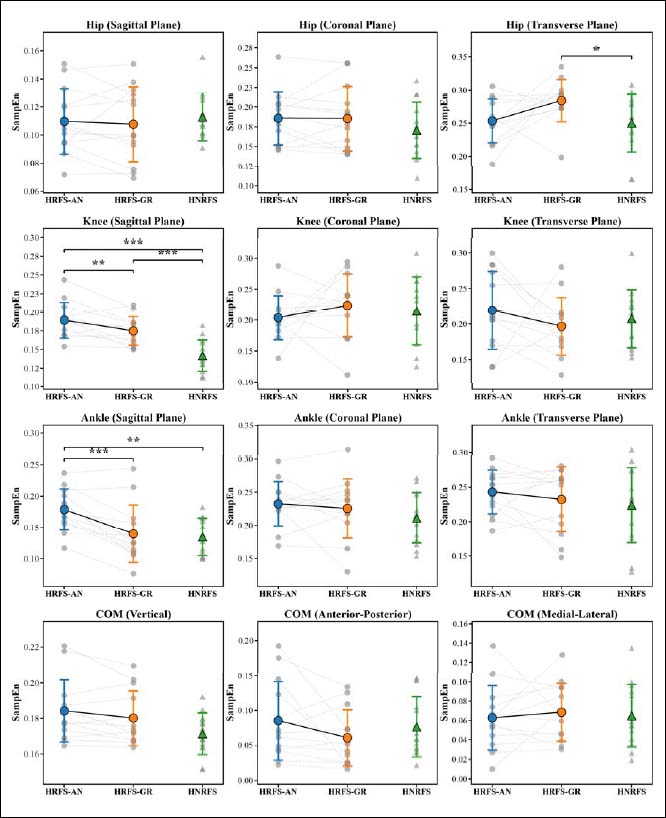
Supplementary Figure S3.
Comparison of SampEn of lower-limb continuous joint angle and COM time series in the sagittal, coronal, and transverse planes among the HNRFS, HRFS-AN, and HRFS-GR groups. *p < 0.05; **p < 0.01; ***p < 0.001. SampEn parameters were set to m = 3 and r = 0.25.