 |
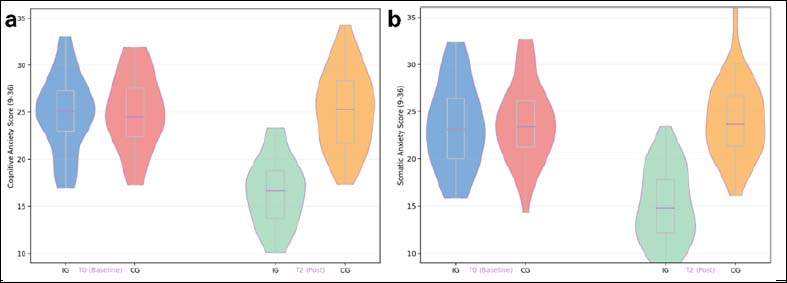
Figure 3.
Distribution of anxiety scores at baseline and post-intervention. Violin and embedded box plots show CSAI-2R cognitive anxiety (panel a) and somatic anxiety (panel b) for the intervention and control groups at T0 and T2; the y-axis is the subscale score (range 9-36).