 |
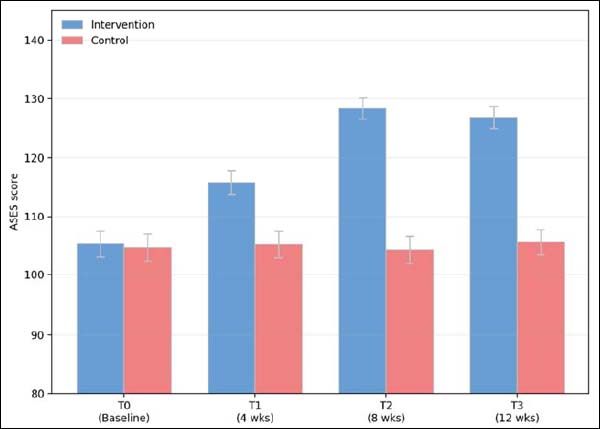
Figure 4.
Comparison of mean self-efficacy scores over time. Bars show mean ASES scores for the intervention and control groups at T0, T1, T2, and T3; error bars represent standard errors (intervention n = 35; control n = 35 in the intention-to-treat sample).