 |
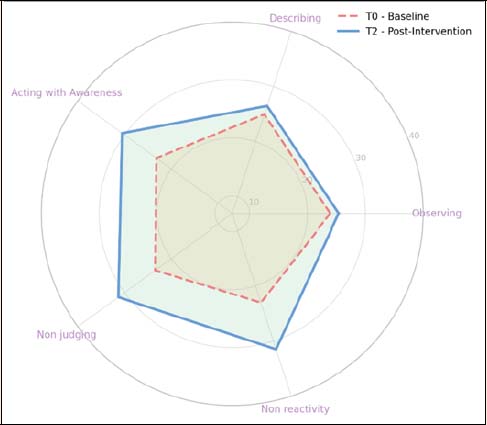
Figure 6.
Profile of change in mindfulness facets for the intervention group. Radar axes show the five FFMQ facets; higher values indicate greater mindfulness skills. Dashed red values represent T0 baseline scores and solid blue values represent T2 post-intervention scores for intervention-group participants.