 |
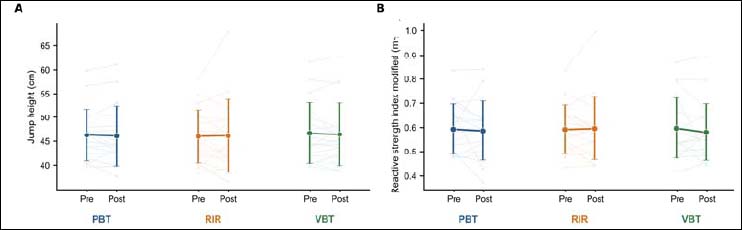
Figure 2.
Pre- to postexercise CMJ responses under the three load-regulation protocols. (A) Jump height; (B) modified reactive strength index (RSImod). Light-colored lines represent individual pre- to postexercise changes, colored solid lines connect condition means, and colored circles with error bars represent mean ± standard deviation. Blue, orange, and green indicate PBT, RIR, and VBT, respectively. Jump height was calculated using the impulse–momentum method.