 |
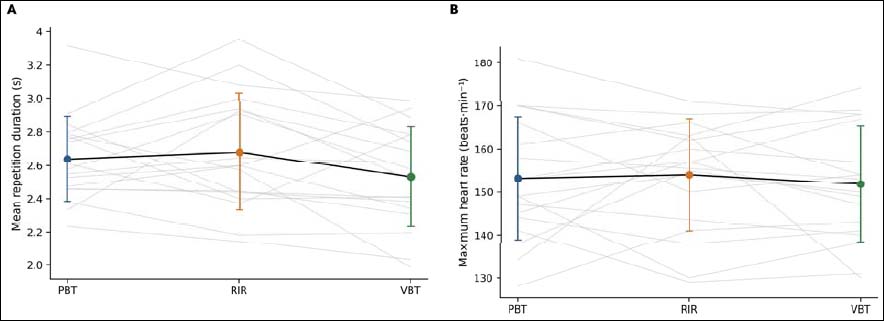
Figure S1.
Supporting training-session outcomes under the three load-regulation protocols. (A) Mean repetition duration; (B) maximum heart rate. Individual values are shown in light gray; colored circles and error bars represent mean ± standard deviation. PBT, RIR, and VBT are shown in blue, orange, and green, respectively.