 |
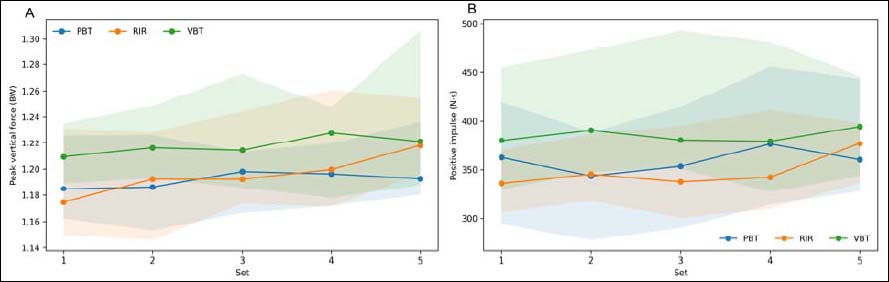
Figure S2.
Exploratory set-by-set trajectories across five back-squat sets. (A) Relative peak vertical force; (B) mean positive vertical impulse. Solid lines represent condition medians and shaded regions show interquartile ranges. Relative peak vertical force was normalized to the set-specific athlete–barbell calibration force. PBT, RIR, and VBT are shown in blue, orange, and green, respectively. Exploratory set-by-set model results: relative peak vertical force (condition p = 0.208, linear set p = 0.055, interaction p = 0.994); mean positive vertical impulse (condition p = 0.142, linear set p < 0.001, interaction p = 0.090); and mean repetition duration (condition p = 0.106, linear set p = 0.055, interaction p = 0.213).